Watching the Run
A run shows itself two ways at once, and they answer different questions. The canvas shows what is happening now. The strip charts show the whole mission as one picture, so they are where you find out where the interesting part is. Use the charts to choose a moment; use the canvas and the Step Info column to look at it.
Where it is
The Execution page at /execution. The center column holds the 3D canvas and, under it, the
Session Info panel. The panel has no title row: its tabs are the top edge. In order they are
Color Index, Availability (only while Preference › Show Physics Options is on),
Surface Roughness, Shell, NC Diagnostics, Step Diagnostics, NC Manipulation,
and Tabs, whose boxes choose which of the others the bar shows. The three charts are the first
of those tabs, and one of them is open at a time. The menu bar's four toggles carry no text: each
is a glyph of the page with its own part filled, and their tooltips read Toggle the Control Tree /
editor dock, Toggle the 3D Rendering Canvas, Toggle the Session Info panel and Toggle the Step
Info column. This manual calls them LEFT, Center-Top, Center-Down and STEP.
Center-Top shows the canvas and Center-Down shows the Session Info panel; either can be on alone,
and with both off the center column is not drawn and
its width goes to the columns that remain. The canvas header has no control for hiding the canvas.
The canvas
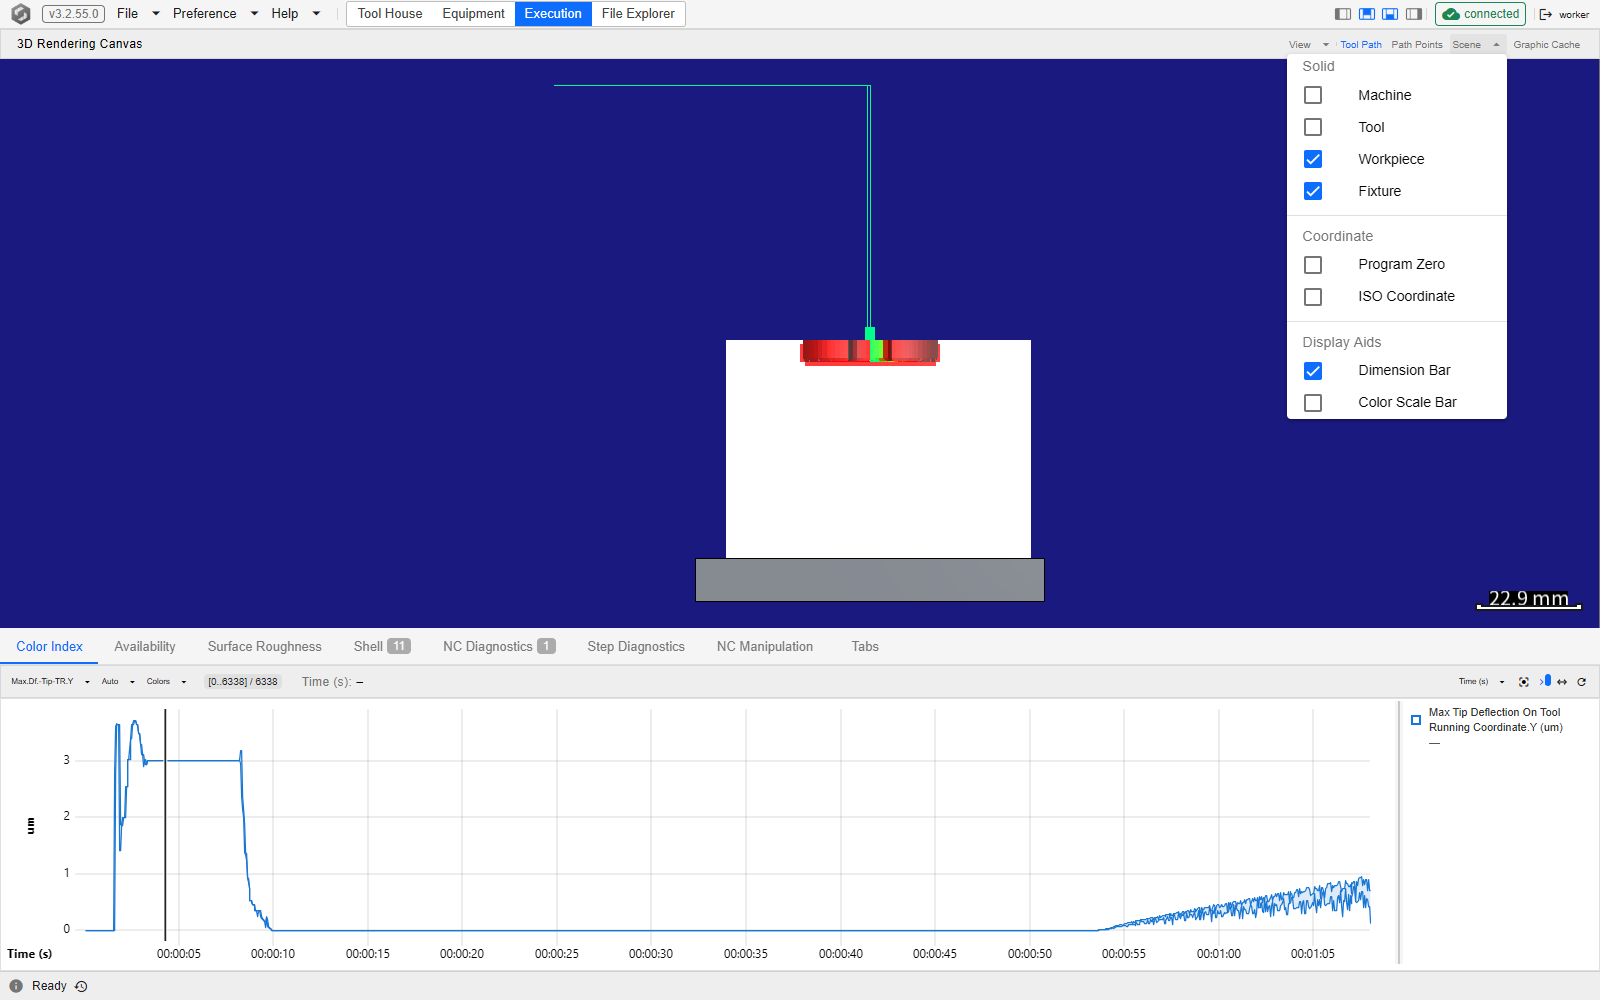
What the canvas draws is a choice, not a fixed set. It opens showing the workpiece, the fixture, the dimension bar and the tool path. The machine and the tool are not drawn until you ask for them — which is usually what you want, because a five-axis machine at home position fills the frame and hides the cut you came to watch.
The panel header carries the generic camera control — a View menu of seven presets: Isometric, Front, Back, Right, Left, Top and Bottom — and beside it the four that belong to a run:
| Control | What it does |
|---|---|
| Tool Path | Shows or hides the tool path through the whole program |
| Path Points | Adds the per-position dot markers along it. Editable only while Tool Path is on |
| Scene ▾ | Which elements are drawn, in three groups |
| Graphic Cache | The memory budget for the workpiece's rendering cache |
The Scene menu groups its checkboxes the way the renderer groups them: Solid — Machine, Tool, Workpiece, Fixture; Coordinate — Program Zero, ISO Coordinate, and Heidenhain Coordinate on a Heidenhain project only; Display Aids — Dimension Bar, Color Scale Bar. The tool path is deliberately not in this menu: its own button owns it, and Path Points hangs off that.
Graphic Cache opens one panel of its own — the memory budget for the workpiece's rendering cache, described under Preferences. The ideal-versus-actual difference is not on this toolbar. A comparison that was actually built shows up instead as a Geometry Difference [radius mm] node on the Control Tree's Program branch, and that node's panel is where its colour-scale Visual Radius is set — a value saved with the project rather than with the browser or the service. The node is there only while a computed difference is attached, so the branch itself answers "did this run leave a difference?"; see The Program Branch.
Hiding the canvas does not disconnect it. Center-Top takes the pane away, header and all, and the canvas stays mounted with its connection kept and its engine paused, so showing it again is instant rather than a fresh connection. Center-Down is separate: it hides the Session Info panel, and the chart that was open unmounts with that pane.
The pointer on the canvas moves the camera, and on the tool path it also picks a step:
| Gesture | What it does |
|---|---|
| Click on the tool path, or on a cut face | Selects that step — the same selection a chart click makes, so the Step Info column fills — and, while a Program node is selected in the tree, brings the Program viewer to the step's line, in its own file and pass, switching Follow off |
| Left-drag | Pans |
| Right-drag | Rotates |
| Wheel | Zooms |
| Hover over the tool path, or over a cut face | Marks the step under the pointer, as hovering a chart does: the charts' crosshair moves to it |
A click is judged when the button comes up: it must go down and come up on the same step, within a few pixels, so a hand's jitter still clicks, while a drag that starts on the tool path or on a cut face only moves the camera and selects nothing. A right or middle click selects nothing either.
The Scene menu open over the canvas at /execution, with the Session Info panel open under the
canvas. The three groups are the ones listed above, and the ticked boxes are the set the page opens
with — Workpiece, Fixture and Dimension Bar — with Machine and Tool unticked.
The three strip charts
The three charts are tabs of the Session Info panel. One group bar drives whichever tab is open, and the three share one window and one selection, so a gesture on the open chart is there when you open either of the others. Each plots the whole mission rather than the current moment:
| Chart | What it plots |
|---|---|
| Availability Chart | Five ratios: stress, max spindle torque, max spindle power, spindle working temperature, thermal stress |
| Surface Roughness Chart | Re-cut depth, program-side cusp, and the change in tip deflection in X / Y / Z, in µm |
| Color Index Time Chart | One property you pick, from every step property the run can quantify |
Each series is drawn as a band between its minimum and its maximum, not as a line through samples: the window is downsampled to the width it has on screen, so what you are reading is the shape of the run — where the spindle is loaded, where surface quality degrades, where thermal limits are approached — rather than individual values. The values themselves are in the legend panel down the side of each chart, which follows the cursor and can be dragged wider. The properties whose value names something rather than measures it are drawn otherwise: Tool ID, FileNo, Stress Critical Zone and Stress Onset Zone as IDs, and a color tree's key as one lane per leaf; see Tool ID and FileNo and A color tree below.
The Surface Roughness chart plots the geometric and deflection contributions to the finished surface. It does not compute a roughness parameter such as Ra or Rz, and it has no series for the cusp left between neighbouring passes; see Surface Roughness Values. Its re-cut depth is how far the cutter's deflection moves the outer end of a flat end mill's bottom edge along the tool axis, so it is meaningful only for a flat end mill.
All three carry a Y-axis range editor on the group bar, in front of the controls they share,
behind a button that reads Auto
until you change it. Its three choices are Fit (auto), which follows the data; Lock, a Min
and Max you type, after which the button reads them as [min, max]; and Symmetric, about zero
with a ± bound you type, which the button shows as ±bound. Locking one is how you compare two
parts of a run without the axis moving under you. The Color Index chart hides that button while it
plots Tool ID, FileNo, Stress Critical Zone, Stress Onset Zone or a color tree's key, and adds
two controls of its own: the property picker, which is a
type-to-filter list of every quantifiable step property in two groups — Engineering view, the
color trees, HiNC's built-in ones first, captioned Built-in
(Engineering View Coloring), and Science view, every other
property, each with its unit under its name: typing mm/min finds the feedrates, a group the filter
empties is left out, and Enter picks the first row shown — and Colors, which edits the colour guide. The machine coordinate of a wrap-around rotary axis picked there, MC.B for one, is drawn
between 0° and 360° as the controller's position screen shows it, so a table that keeps turning the
same way draws a sawtooth rather than a line that runs off the chart; the step file keeps the
continuous angle. Colors is worth understanding before you touch it: it drives the colour of the
workpiece in the 3D scene and the colour scale bar, not the line in the chart — and both of those
read the continuous angle the step file carries, not the folded one, so a colour range for MC.B
is set against −720° for two turns the same way, not against the chart's 0–360°.
The group bar
| Control | What it does |
|---|---|
| Range chip | The slice of the mission currently shown, against its total step count |
| Cursor readout | The x-value under the pointer, shared by all three charts |
| X-axis mode | Time (s) or Step index, applied to all three at once. The plot prints the short form at the lower left, on the same line as the tick labels: Time (s) or Step |
| Fit view | Fits the 3D canvas to where the steps in the window cut — to their whole tool path when none of them cut, or to the home view when there is no tool path yet — the one control here that acts on the canvas |
| Stick to live end | Keeps the window's right edge pinned to the running end of the mission |
| Reset display range | Back to the whole mission, and re-arms stick-to-end |
| Reload | Re-fetches all three charts |
Stick-to-end stays on through a zoom or a pan whose new window still reaches the running end — zooming out, or panning towards the end — and turns itself off the moment one stops the window short of the end, because that sets a definite right edge. That is the behaviour you want while a run is going — you can look at something without being dragged back to the live end — and Reset display range is how you re-arm it.
Tool ID and FileNo
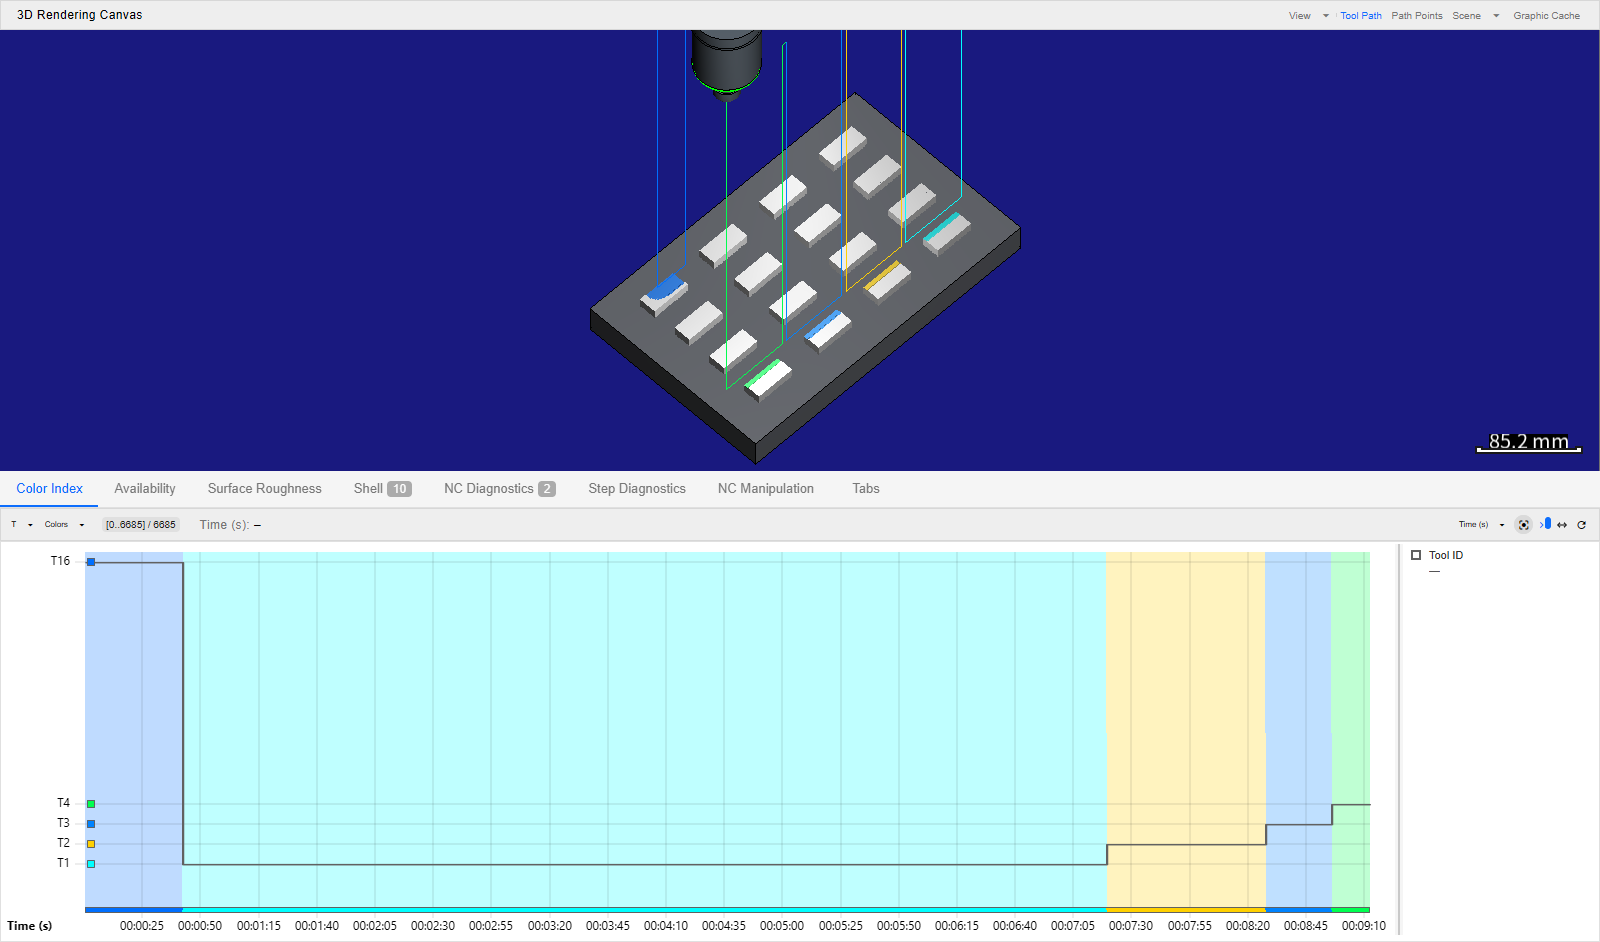
Tool ID is the tool in use during a step, cutting or not. FileNo numbers the program as it plays: each program file of the run takes the next number, and so does each subprogram or macro call — every repetition of a repeated call separately — and each jump inside a program, such as a GOTO or the next pass of a loop, so one file can carry many numbers. Both values name something rather than measure it, and picked in the Color Index chart either one is drawn as IDs:
- A grey staircase steps from one ID to the next. Each stretch of the run is tinted in its ID's colour, and a band in the same colours runs along the bottom of the plot.
- The Y axis lists only the IDs in the window —
T16,T1for tools, the bare number for FileNo — each with a swatch of its colour beside it. On a short chart some labels are left out so that they do not overlap, and their colours still show in the band. Pointing at a label, or at the swatch beside it, shows that ID's name, and so does a label the axis left out. Where one pixel column of the chart holds several IDs, only the lowest and the highest of them reach the axis, the tint and the band; zoom in to see the ones between. - The legend reads the ID under the pointer,
T3, or the lowest and highest,T1 ~ T3, where one pixel column holds more than one.
The 3D scene takes the same colours: every cut face and every stretch of the tool path is in the colour of its step's ID, and the swatches on the Y axis are the key, since the canvas draws none of its own. A tool ID or a file number keeps its colour — T3 is the same colour in every program and every run — and IDs next to each other get colours far apart. Some IDs further apart come out close — those 5, 8, 13 or 21 apart, as T3 and T16 do below, both blue — and from ID 378 on, two IDs can even share a colour; the Y axis tells them apart. No tool ID or file number is ever red or close to it, since the scene uses red for collisions, and none is a deep blue that would vanish against the canvas background. Colors has no range to set for these two — it reads This guide has no editable range. — and the colour scale bar is not drawn while either of them colours the scene, even with Color Scale Bar ticked under Scene.
A run that cut with five tools, T16 first and then T1 to T4, with Tool ID picked on the Color Index tab, the canvas in the Isometric view and fitted with Fit view, which frames the cuts, and Tool ticked under Scene so the tool and its holder are drawn. Availability and Surface Roughness are the neighbouring tabs.
Stress Critical Zone and Stress Onset Zone name something as well: the part of the cutter where a step's stress ratio is highest, and where it first goes over 100 % counted from the tip — Flute, Taper or Cylinder, and None for a step with no such part; how to read them is in Evaluating Process Machinability. Picked in the Color Index chart, either one is drawn as IDs in the same way, its Y axis and legend naming the zones instead of numbering them, and the 3D scene takes the same colours. As for the two above, Colors has no range to set and the colour scale bar is not drawn.
A color tree
A color tree — one the project defines on the Step Colors root of the Control Tree
(Step Colors), one a mission script registers (RegisterStepColorTree, see
Step), or one of the two HiNC builds in
(Engineering View Coloring) — sorts the steps into leaves by
conditions on their properties; how a tree sorts them is in
Color Trees. Its value on a step is the number of
the leaf the step falls into, and picked in the Color Index chart — or made the color index with
Set as color index on its panel — it is drawn in lanes:
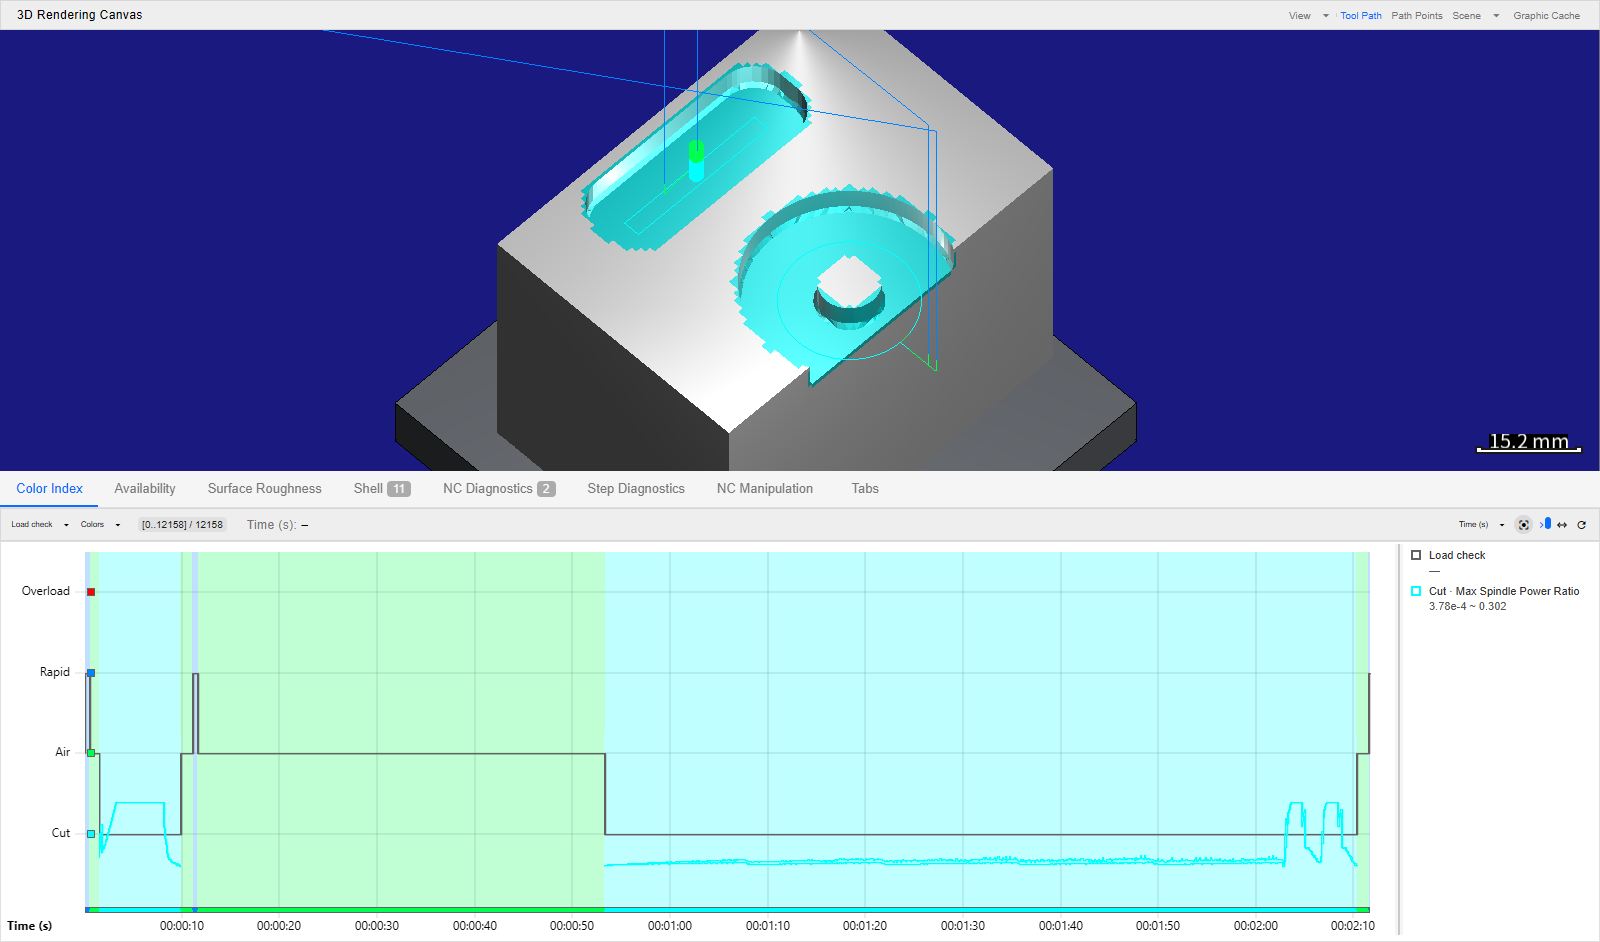
- One lane per leaf, the tree's first leaf at the top. Every lane is drawn whether or not a step of the window fell into its leaf, so the axis never rescales while the run plays, and an empty lane is an answer too. A grey staircase steps between the lanes, each stretch is tinted in its leaf's colour, and a band in the same colours runs along the bottom of the plot, as for a tool ID.
- The Y axis names each lane by its leaf's short name — the leaf's name when it has no short name, an unnamed leaf by its number — beside a swatch of its colour. A label still too long for the axis is cut short with an ellipsis (…). Pointing at the label, or at the swatch beside it, shows the leaf's full name, and so does a lane whose label the axis left out. The legend and Colors give the full name as well. Up to thirteen lanes the chart is tall enough for every label; with more, a label without room is left out, as on a short ID chart.
- A pixel column that holds steps of several leaves has its tint split into one stripe per leaf, the top lane's on top, while the staircase and the band show the highest and the lowest of them. A tree of more than 32 leaves splits the tint into halves instead, as an ID chart does.
- A leaf that shows a value — one given a Value shown on the time chart on its panel — carries a band of that value inside its own lane, in its colour, from the least to the greatest value of the leaf's steps in each pixel column. The band is scaled to the leaf's own range in the window, its least value at the bottom of the lane and its greatest at the top, so its numbers are read in the legend; an overload, an infinite value, sits on the lane's edge, and a column without a step of the leaf leaves a gap. No band is drawn for a physics value while Preference › Show Physics Options is off.
- The legend names the leaves of the pixel column under the pointer, the top lane's first,
separated by a slash —
Rapid / Air / Cut; in a tree of more than 32 leaves, only the top lane's and the bottom lane's, joined by a tilde,Rapid ~ Cut— and gives each leaf that shows a value a row of its own, such asCut · Max Spindle Power Ratio, with that column's least and greatest value, or the window's when the pointer is off the chart. A value leaf's row is listed only while some step of the window fell into that leaf — on an ordinary cut, Stress overload and the spindle overload leaves are absent — while the tree's own row stays, and the lanes do not change.
A window in which no step fell into a leaf — a tree without a leaf that takes every step, or a stretch none of its leaves takes — shows its empty lanes rather than No physics data. The tint, the band, the swatches and the 3D scene take the colour the tree gives each leaf, which can be any colour, red included; a leaf given no hue takes the colour its number has as an ID. A step that falls into no leaf is a gap in the chart and pale green in the 3D scene, the colour of a step without a value, and the colour scale bar is not drawn.
Colors shows the tree in place of a colour range: Color tree: with the tree's name, In the display range, and a table of the leaves in the tree's order — each with its colour, its name, its Steps and its Time share in the display range — and a No value row when some steps fell into no leaf. Until the chart has read every step's value, the counts read —. Under the table, Edit color tree → opens the tree's panel on the Step Colors root; a tree a script registered has no panel, and reads Registered at run, read-only instead. A built-in tree reads Built-in, read-only, with Copy to project tree…, which copies it into the project's trees and opens the copy's panel; above its table it lists what the leaves cannot show about the steps since the last reset — collision detection that was off or ran without a collision licence, steps from a CSV program, a recorded play under review, and for Machining State the physics switched off, the spindle capability the ratios are read against and the tools whose stress ratio could not be evaluated (Engineering View Coloring). While the physics options are hidden and the color index is Machining State, the chart draws Machining State (No Physics) in its place, and Colors keeps the full tree, the 3D view's.
The run pictured on Step Colors, at /execution, with that page's example tree, Load check,
as the color index: four leaves, Overload, Rapid, Air and Cut from the top, Cut showing the max
spindle power ratio. The Color Index tab is open. The canvas is in the Isometric view and
fitted with Fit view. These leaves have no short name, so the lanes print their names.
Reading a chart with the pointer
The three charts share one window and one selection, so a gesture on any of them moves all three.
| Gesture | What it does |
|---|---|
| Click | Selects the step under the pointer — where a pixel column holds many steps, the first of them, and on a color tree's chart the first step of the column's top leaf — which is what fills the Step Info column, and, while a Program node is selected in the tree, brings the Program viewer to the step's line, in its own file and pass, switching Follow off |
| Drag left or right | Sweeps a range and zooms to it on release |
| Right-drag or middle-drag | Pans |
| Wheel | Over the plot, zooms about the pointer. Over the legend, scrolls the legend and does not zoom |
| Point at a Y-axis label or its swatch | Shows that lane's or ID's full name |
| Hover | Puts that x-value in the group bar's cursor readout, and marks the step a click there would select on the tool path in the canvas |
| One finger / two fingers | Pans / pinch-zooms, on a touch screen |
A left drag shorter than a few pixels counts as a click, so selecting a step does not need a steady hand. The selected step — the vertical rule across the charts — and the hovered one — the crosshair — stand on every chart in the pixel column that holds the step, whether it was picked on that chart, on another or on the canvas.
Hovering is the light-touch twin of clicking. A click selects a step and fills the Step Info column;
a hover only tells the engine which step the pointer is on — the step a click there would select —
and the canvas answers by lighting up that step's cutter location on the tool path — a dot with its
@index label beside it, a short segment from the position before it ending in an arrowhead that
points the way into this position, and a short grey line along the tool axis with a dot at its end —
so sweeping the pointer along a chart walks a marker along the cut. A step whose tool tip did not move has no arrowhead — the first step, or one that
only turns the rotary axes under RTCP — and neither does a move pointing straight into or out of
the screen, such as a plunge seen from above; turn the view a little and it shows. On a tool-change
step the segment runs from the old tool's tip to the new one's: the tip jumped with the tool, it
did not travel. The marker goes away when the pointer leaves the chart, it is only drawn while
Tool Path is on, and a touch screen has no hover, so it never appears there.
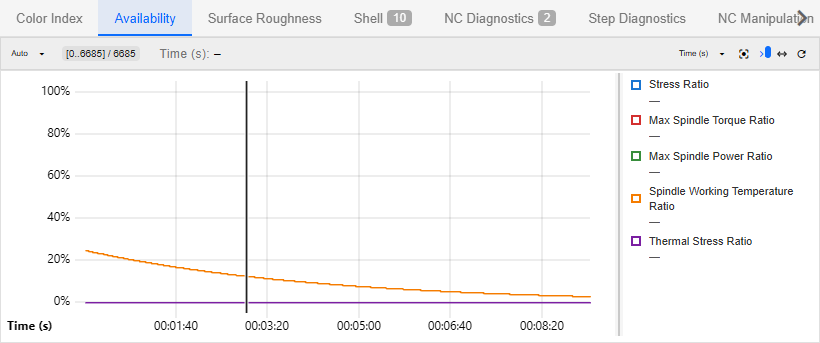
Before anything has run, all three read No mission data. A chart that has data but no physics behind it reads No physics data instead — that is what the Availability chart looks like when the run produced no physics results.
The Availability tab of that five-tool run, with a step selected. The vertical rule is that selection; it stands on the Color Index and Surface Roughness tabs as well, because the three share one window. The range chip on the group bar names the window, and the x-axis name sits at the lower left on the same line as the tick labels. The transport and the run-state badge sit in the run header at the top of the Control Tree pane, outside this picture.
See Also
- Running a Simulation — the rest of running a job
- Starting and Stepping — the transport that makes these fill
- Inspecting a Step — the per-step detail a click on these charts opens
- The Application Window — the menu-bar toggles that show and hide the canvas, the Session Info panel and the Step Info column
- Strip Charts — the components behind these tabs: the shared window, the pointer contract and the data behind each series
- Step Variables — your own values of each step, which the strip charts plot and colour by
- Step Colors — the color trees, whose key the Color Index Time Chart draws as a lane per leaf, and the panel Edit color tree → opens
- Engineering View Coloring — HiNC's built-in trees at the top of the picker's Engineering view, the notes their Colors dropdown lists, and the stand-in while the physics is hidden
- The Program Branch — where a run's Geometry Difference node appears, and where its Visual Radius is set
- Execution Extended RenderingCanvas Tool Bar — the component behind the canvas header's run controls