RPTU Benchmark Part 8 on a Machine with Three Measured Squareness Errors: At Most 1.7 µm on an ISO 10791-7-Style Test Piece, and Each Family of Features Reads One Angle
Part 8 of the RPTU three-axis benchmark is a public test part. An AI agent had already turned its model and program into an accepted HiNC project. Of the ten parts, it is the one made after ISO 10791-7, the test piece for machining centres. From the top down it has a Ø54 mm boss, a 54 mm square turned 30°, a step whose front and left faces run at 3°, and a 78 mm block. ISO uses circles, diamonds, inclined faces and squares like these to read a machine's geometric errors off a piece of metal.
Holub et al. (2020) measured a three-axis vertical machining centre with a laser tracer. Before compensation, its squareness errors were about 24 µrad between X and Y, 33 µrad between Y and Z and 56 µrad between Z and X. On this page the agent builds each of the three into part 8's machine as an error term, directly upstream of one linear axis. Not one character of the program was changed. The program was played at 1 mm and at 0.25 mm, three times at each grid:
- Error terms off: the nominal cut. The nominal cut at each grid is the ideal geometry for the geometry differences at that grid.
- Error terms on, errors marked: the controller does not know the three squareness errors, as on a machine without compensation. The program is a plain three-axis one, so the errors are cut into the part whether they are marked or not. No unmarked run was played.
- Error terms off again, with the geometry difference: the control run. It measures the noise floor.
What came out:
- The tool tip. On all 159,337 cutting steps the tip lands on the exact formula of the three angles, within 1.24 × 10⁻¹³ mm per component. The angles fitted back from the steps are 24.43, 33.16 and 55.85 µrad, the values put in.
- The part. The cut part was measured vertex by vertex against the nominal cut, and 1–99 % of the vertices lie within −1.144…+1.481 µm. The deepest over-cut on a wall is −1.640 µm and the most material left is +1.69 µm, both near the +X end of a face.
- One angle per family of features. The block's front and back faces slope along X by ±24.4 µm/m (X–Y). Its left and right faces slope with height by ±56.0 µm/m (Z–X). Each corner of the 30° square changes by 0.65–0.66 µm over 54 mm, and the Ø54 boss becomes two lobes, 0.733 µm out of round. All three angles can be read back from the cut part to within 1 %.
- Size follows travel. Z–X, the largest of the three angles, tilts the walls of this 17 mm deep part by less than 1 µm. X–Y, the smallest, comes to nearly 2 µm over the 80 mm part; over the 320 mm test piece of ISO 10791-7 it would come to 7.82 µm.
Everything here is simulated; nothing was cut.
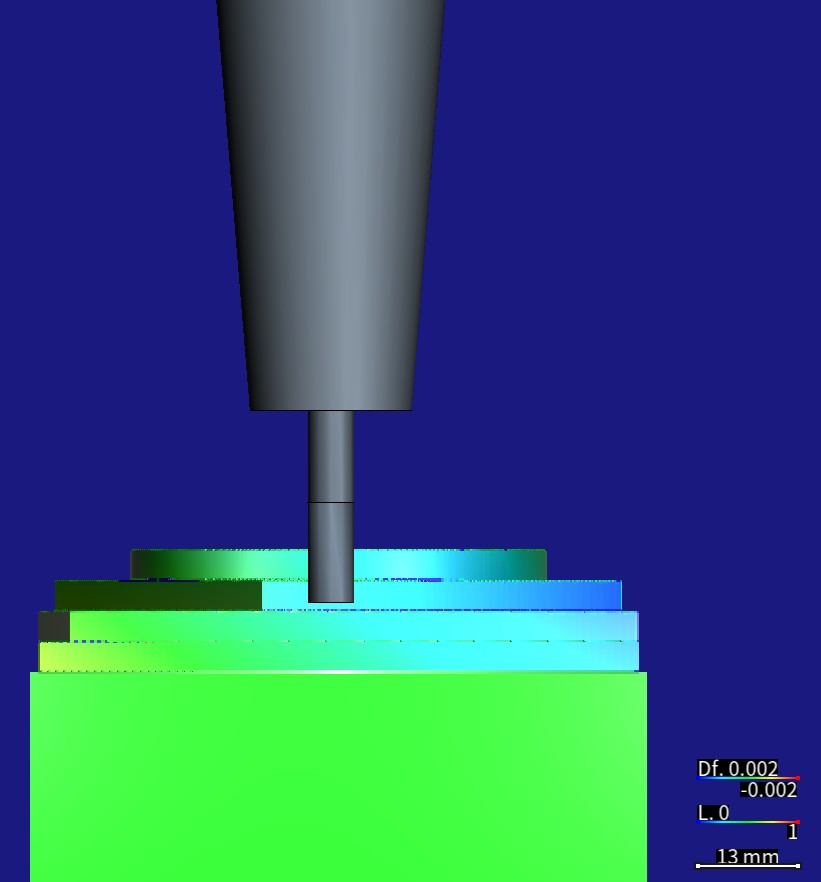
The stock the marked run recorded, put back on the canvas with its geometry difference and seen from the front. A parking program that cuts nothing then moves T1, the Ø6 flat end mill in its shrink-fit holder, to a point in the air outside the 78 mm block's front face (X40 Y−6 Z−8). From the top down: the Ø54 boss, the 30° square, the 3° step and the block's front face. The X–Y squareness makes the material left grow along X, so the faces turn cyan and blue toward the right (+X); the uncut stock below stays green. Colour scale ±0.002 mm: red = cut too deep, blue = material left, green = 0, with both signs weighted alike. Measured on a HiNC 3.2.46 development build with error-term branches, 0.25 mm grid.
| Part 8 at 0.25 mm on a HiNC 3.2.46 development build with error-term branches | Predicted | Measured |
|---|---|---|
| Tool tip minus the nominal tip minus the exact formula, 159,337 cutting steps | 0 (the plan allowed 10⁻⁹ mm) | at most 1.24 × 10⁻¹³ mm per component |
| Angles θ (X–Y), φ (Y–Z), ψ (Z–X) fitted from the steps | 24.43, 33.16, 55.85 µrad, as built | 24.43, 33.16, 55.85 µrad |
| The cut part against the nominal cut, all vertices, 1st / 99th percentile | — | −1.144 / +1.481 µm |
| Over-cut at the +X end of the block's back face / material left at the +X end of the 3° step's front face | −1.642 / +1.671 µm | −1.640 / +1.676 µm |
| 78 mm block, front / back face, slope along X | ±24.43 µm/m | +24.39 / −24.45 µm/m |
| 78 mm block, left / right face, slope with height | ±55.85 µm/m | +55.99 / −56.01 µm/m |
| 78 mm block, left face turned against the front face, over 78 mm | +1.906 µm | +1.903 µm |
| 30° square, change of each corner, over 54 mm | ±0.66 µm | −0.658, +0.663, −0.659, +0.653 µm |
| Ø54 boss, centre shift / two-lobe roundness | (+0.168, −0.902) / 0.733 µm | (+0.169, −0.902) / 0.733 µm |
| Control run, error terms off, with the geometry difference | 0 | the nominal run's steps bit for bit; its pictures read by hue within −0.034…+0.036 µm |
| Server time of the six plays / peak memory of a 0.25 mm play | — | 405.6 s / 1.35–1.69 GB |
The case
The page of parts 4–10 tells how the agent built part 8, as published on Zenodo, into a HiNC project. It placed the model using the program's own motion, made the stated 50 mm block 51 mm, gave the program a standard Ø6 end mill in a shrink-fit holder, and accepted it with replays at 1 mm and at 0.25 mm. That machine was built as designed, with no error. This page puts three squareness errors measured on a real machine into the same machine and asks one question: which squareness does each family of ISO features read, and how much of it? What the agent was given:
- The accepted project and its program.
8.ngchas 11,894 lines and plays 192,851 steps on the case's machine. It uses one tool, T1, a Ø6 flat end mill atS18000, withG54andG43 Z15. H1. It has only straight lines andG17/G18/G19arcs: a plain three-axis program, with no RTCP, no tilted plane and no CL. Nine operations cut the block down from its top face to five levels, Z−1, −5, −9, −13 and −17. Each main wall comes from one finishing pass at one height:2D-KONTUR1, the Ø54 boss, its cutter centre on a circle of 30 mm radius;2D-KONTUR2, the 30° square;2D-KONTUR5, the front and left faces of the 3° step;2D-KONTUR4, the 78 mm block, its cutter centre along X−1 and X83, Y−1 and Y83.
- The machine. HiNC's generic XYZ skeleton
Empty-wXYOZSt: the table moves in X and Y, the Y slide riding on the X slide, and the head moves in Z. It has no shapes and no spindle role bound.G54is (−441, −291, −529), and the tool length is 105 mm. - Squareness errors measured on a real machine. Holub et al. (2020) calibrated a KOVOSVIT MAS MCV 754 QUICK three-axis vertical machining centre with a LaserTRACER. LTc1 is the calibration made before compensation; its three squareness values were read off the bar chart in the paper's Fig. 6. For X–Y the paper also prints a ballbar value of 22.4 µm/m (Table 8).
- HiNC's error terms. An axis or the spindle of the machine chain can be given an error term, a static branch of its own just before the axis's branch: it
carries a measured error rather than part of the design. The controller is
XyzabcSolver, which turns NC into machine coordinates. It always solves on the nominal chain: the same chain with every marked branch left out. While the project's Enable Error Terms switch is on, the simulated machine keeps the marked branches when it moves, cuts and checks collisions. So the error is cut into the part, as on a real machine whose controller does not know it. Each step's machine coordinates are the same with the switch on and off; the tool tip, the cut and the collisions differ. Without RTCP or a tilted plane, every error in the chain is cut into the part, marked or not (Error-Term Branches). - Touch-off and P0. HiNC's P0 measures program zero on the nominal chain. On a real machine,
the
G54found by touching off already contains the constant shift the errors cause at the touch-off pose. - A placement rule. HiNC's product owner ruled that an error term goes only directly upstream of a
role branch, meaning an axis X … C or the spindle, with one new anchor for each error, named
<axis>err. - The request. HiNC's product owner asked for showcases of HiNC's error terms built on accepted cases, from both product cases and paper cases, with the heavy runs on a shared server.
What nothing states:
- Which part. The designer agent, the agent that drafted this study, was handed part 7 as its starting point (dilemma 1).
- Which axis each squareness goes on. An axis takes only one error, and Z already carries Y–Z, so Z–X has to go elsewhere (dilemma 2).
- The signs. The paper describes its errors by the ISO 230-1 convention but prints no sign rule, so they are read here by the right-hand rule. If the signs were the other way round, material left and over-cut would swap on every face, at the same size.
- Where the pivots go so that
G54need not change (dilemma 3). - Whether a 0.25 mm grid can show differences below 1 µm (dilemma 4).
What is new here:
- Three errors on three axes at once: two on the table side, upstream of X and Y, and one on the tool side, upstream of Z. The tool-tip offset is the exact product of three rotations.
- The cut part read as a test piece. Each face's deviation, slope and turn are computed the way a CMM would compute them, as ISO 10791-7-style indicators, and compared with the predictions written before the first play.
- The floors computed by sweeping a tilted flat end. The floors' deviation is computed by sweeping the tool's tilted flat end over every step. It matches even the material left that the design did not expect.
What the agent built
Each value is marked read (from the paper or the base case), derived (computed from what was read) or chosen (the agent's decision). θ, φ and ψ are the X–Y, Y–Z and Z–X squareness errors.
| Error | What it is | Where it sits | Value | Pivot | Source |
|---|---|---|---|---|---|
ZXsq (ψ) |
The Z–X squareness. The X slide, with the Y slide, the table and the part on it, turns about +Y by ψ. In the part's coordinates that is the Z travel and the tool axis turned about +Y by −ψ, so the tool moves toward +X as it goes down. For the cut it equals EB0Z = −55.9 µrad in Holub's sign | base→Xerr, directly upstream of X; a Static Rotation about (0, 1, 0) |
0.0032° = 55.85 µrad | (0, 0, 471), base coordinates | read: Fig. 6, EB0Z about −56 µrad (±1–2 µrad reading the chart); chosen: on X, with the sign by the right-hand rule (dilemma 2) |
XYsq (θ) |
The X–Y squareness EC0Y: the +X and +Y travels stand at 90° + θ, an obtuse angle. The Y slide carries the table, so in the part's coordinates the X travel leans toward −Y: sent to program X, the tool lands θX toward −Y | X→Yerr, directly upstream of Y; about (0, 0, 1) |
0.0014° = 24.43 µrad | (−441, 0, 471), X anchor coordinates | read: Fig. 6, about +24 µrad; Table 8's ballbar value, 22.4 µm/m, agrees |
YZsq (φ) |
The Y–Z squareness EA0Z: the Z travel, with the spindle and the tool, turns about +X by φ. +Z leans toward −Y, so the tool moves toward +Y as it goes down | base→Zerr, directly upstream of Z; about (1, 0, 0) |
0.0019° = 33.16 µrad | (0, 0, 471), base coordinates | read: Fig. 6, about +33 µrad |
The plan read 55.9, 24.4 and 33.2 µrad. Typed into the project to 0.0001°, they became 55.85, 24.43 and 33.16 µrad. That is less than 0.1 µrad apart, inside the error of reading the chart.
- The chain read back after the build. Table side
O→base→Xerr→X→Yerr→Y→w, tool sidebase→Zerr→Z→S→t. The Dynamic Translations of the X, Y and Z axis branches, (−1, 0, 0), (0, −1, 0) and (0, 0, 1), moved whole ontoXerr→X,Yerr→YandZerr→Z. Axis X, Y and Z were bound to them again, with their values unchanged.NewAnchor-001,NewAnchor-005,NewAnchor-006andtooling-locationare as they were. - Every pivot at the tool tip of the touch-off pose (derived). At the touch-off pose the tool tip
is at program zero, so machine Z is
G54Z −529 plusH1105, which is −424. In the base, the tool tip then stands at machine Z + 1000 (tooling-location) − 105 (the tool length) = 471. That is (0, 0, 471) in base coordinates and (−441, 0, 471) in the X anchor's. The deviation at the touch-off point is zero, so the case'sG54(−441, −291, −529) is used as it is, and no work offset is typed in (dilemma 3).

The machine cluster (GeneralMechanism) in the Topology column of the Equipment page. A new anchor now sits directly upstream of each of the X, Y and Z axis branches: Xerr, Yerr and Zerr. ZXsq (base → Xerr), XYsq (X → Yerr) and YZsq (base → Zerr), three Static Rotations, are drawn thick and carry the orange Error term badge. The X, Y and Z Dynamic Translations still play Axis X, Y and Z. A HiNC 3.2.46 development build with error-term branches, English interface.
Where the tip goes: the prediction written in the plan. X, Y and Z are the nominal run's tool tip in program coordinates. The exact offset is
δx = (X − Z·cos φ·sin ψ)·cos θ − Z·sin φ·sin θ − X
δy = −(X − Z·cos φ·sin ψ)·sin θ − Z·sin φ·cos θ
δz = Z·(cos φ·cos ψ − 1)
The designer agent checked these formulas against a model of the chain in which an error branch maps a point q to p + R(q − p), with p its pivot. Over 2,000 random poses the largest difference was 6 × 10⁻¹⁴ mm. To first order, δ ≈ (−ψZ, −θX − φZ, 0). In plain words, with program Z negative downward:
- X–Y: sent to program X, the tool moves θX toward −Y; at X 81 mm that is 1.98 µm.
- Y–Z: going down, the tool moves φ|Z| toward +Y; at Z−17 that is 0.56 µm.
- Z–X: going down, the tool moves ψ|Z| toward +X; at Z−17 that is 0.95 µm.
- The offset does not depend on Y. At X = Z = 0, which is program zero and the touch-off point, it is zero; δz is of second order.
How far the part's faces move. A point on a wall moves along its outward normal n by
d = −θ·n_y·X_c − φ·n_y·z − ψ·n_x·z, positive for material left and negative for cut too deep. Here
X_c is the X of the cutter centre that cut the point (the surface X plus 3·n_x), and z is the
point's program height. The plan's numbers, in µm:
- the 78 mm block's front face +0.50 (from −0.40 at X6 to +1.41 at X76) and its back −0.57: the two stay parallel, and the width does not change;
- its left face −0.84 and right face +0.73, changing with Z only;
- the four sides of the 30° square +1.18, −0.36, −0.55 and −0.27;
- the Ø54 boss: an offset centre plus two lobes, with
c = −θ·R_c/2≈ −0.37 µm, whereR_c= 30 mm is the radius of the cutter-centre path, not the boss's 27 mm; - the floors 0 to −0.19: the tool axis tilts by about 65 µrad, so the flat end's low edge stands up to 3 mm × 65 µrad below its centre.
The runs, each playing the whole program:
| Run | Grid | Enable Error Terms | The three errors | Purpose |
|---|---|---|---|---|
| t-nominal | 1 mm | off | marked (not in effect) | trimmed: nominal; exports its cut (40,625 triangles), the reference for t-on |
| t-on | 1 mm | on | marked | trimmed: the controller unaware; the geometry difference; exports its cut |
| t-control | 1 mm | off | marked (not in effect) | trimmed: control; the geometry difference |
| f-nominal | 0.25 mm | off | marked (not in effect) | exports the nominal cut (374,191 triangles), used as the ideal geometry |
| f-control | 0.25 mm | off | marked (not in effect) | the geometry difference, for the noise floor; exports no cut (dilemma 5) |
| f-on | 0.25 mm | on | marked | the geometry difference; exports its cut (190,615 vertices) |
Common to every run:
- Physics off. This case is about geometry only. Collision detection on, without pausing on a failure.
- One program. Only
8.ngcis on. The parking program for the holder pictures was added to the project after the full runs, as an entry that is switched off. - The case's work offset. Every run used the project's
G54(−441, −291, −529); no work offset was typed in. - The geometry difference (Geometry Validation): detection
radius 1 mm, colour scale (
DiffVisualRadius) ±0.002 mm. - The recorded stock. The on and control runs recorded their final stock. The pictures put that stock back on the canvas with its geometry difference.
How the agent managed the work
- Criteria and predictions first. The plan, its predictions and six criteria were committed at 21:29 on 2026-10-06, and the first play started at 21:49. The design proposed more criteria than the plan's six; the verdicts follow the plan's six only.
- The whole program on a coarse grid first. The trimmed runs do not cut the program down. They only coarsen the grid to 1 mm, the grid the case uses for rough runs. A nominal, an on and a control run were played at 1 mm to check three things: the build, the per-step formula (the tool tip does not depend on the grid), and the affine fit's three angles and its zero offset at program zero. The trimmed and full runs were queued as one background job: the trimmed control run ended at 21:52:22 and the full nominal run started at 21:52:28. So the trimmed runs were checked only after all six had played.
- Three full runs at 0.25 mm, the case's acceptance grid: nominal, control, on. They ran one at a time on a private instance, queued on the lock that the studies on the server share. The instance was restarted before each run.
- The nominal cut as the ideal geometry. The nominal run exported its cut, which became the ideal (target) geometry for every geometry difference. The geometry difference then shows only what the errors change, not the marks the toolpath itself leaves.
- The part's numbers from vertex distances. The on run exported its cut too, and every vertex was given its signed distance to the nominal cut (see the results).
- Every number from the records. The agent's analysis script computes every number on this page
from the run records, the captures and the base case's
8.ngc, and keeps each with its source. It can be run again in about a minute. - Pictures in both interface languages: the geometry difference from six views, two pictures with the holder, and the topology graph. The design proposed replaying a cut-down program for the holder pictures. Instead, the recorded stock went back on the canvas, and a parking program moved the tool in the air only.
- Where a person stepped in. HiNC's product owner asked for error-term showcases built on accepted cases and ruled where an error term may go. The part, the axes, the signs, the pivots, the predictions and the criteria are the agents' own: the designer agent worked them out, and the agent that ran the case wrote them into the plan.
The criteria as committed before the first play:
| # | Criterion |
|---|---|
| 1 | Build: the three errors inserted upstream of X, Y and Z, marked as error terms, with their values read back the same; the three axis roles bound again to their original objects; the roles check empty; the case's files outside the error-term folder unchanged |
| 2 | Every run: Finished, about 192,851 steps, all 11,894 lines executed, no collision; the messages only Sys-Init--FileLines and three Parsing--Unconsumed, plus Diff--TargetNotClosed in runs with a geometry difference |
| 3 | On: on every cutting step, the tip minus the nominal tip minus δ within 1 × 10⁻⁹ mm; the affine fit A ≈ [[0, 0, −5.585 × 10⁻⁵], [−2.443 × 10⁻⁵, 0, −3.316 × 10⁻⁵], [0, 0, 0]], each element within ±1 × 10⁻⁸; its offset b at program zero within 1 × 10⁻⁹ mm |
| 4 | Control: at least 99 % of the vertices within ±0.1 µm of the nominal cut |
| 5 | The part, on against nominal, by vertex distance: the block's front and back faces sloping along X by ±24.4 µm/m ± 15 %; its left and right faces sloping with Z by ±55.9 µm/m ± 20 %; the boss's two-lobe coefficient c within −0.37 ± 0.1 µm |
| 6 | Cost: wall time and peak memory (VmHWM) recorded for every run |
The dilemmas
Each one is told as its situation, the risk if it had been missed, how it was noticed, the resolution, and the evidence that the resolution held.
1. Handed part 7, the designer chose part 8
- Situation. The designer agent was handed RPTU part 7 as its starting point: a pocket with an island of spline outline. Its story on the case page is the three bays a Ø6 tool cannot reach.
- Risk. On part 7 the squareness errors would show only on the pocket's front and back walls and on the island, and a reader could not tell which feature reads which squareness. Its program is also large: 316,161 steps.
- How noticed. The design compared all ten parts. Part 9's program is the largest (435,627 steps). Part 10 is the deepest but carries no ISO meaning. Part 4 had already been used for the trial of the tools. Part 8's source notes say it is the benchmark part of Mertes et al. (2024), based on ISO 10791-7.
- Resolution. Part 8. Each of its four levels comes from one finishing pass at one height, every wall is vertical and every floor flat, so every face can be predicted on its own. In case the study had to stay on part 7, the design worked out part 7's pivots and predictions as well.
- Evidence. Every family of features on part 8 read the angle it should: the X–Y slope of the block's front and back faces, the Z–X slope of its left and right faces, half of θ in the corners of the 30° square, and the boss's two lobes (see the results).
2. Three squareness errors, one per axis: Z–X goes upstream of X
- Situation. A squareness is the angle between two axes, so three squareness errors involve three pairs of axes. The owner's ruling allows one error directly upstream of an axis or spindle branch, and this skeleton machine has no spindle role bound.
- Risk. If Z–X also went in front of Z, Z would carry two errors, against the ruling. If it were moved to another axis with the wrong sign, material left and over-cut would swap on the left and right faces.
- How noticed. While the design derived the placement.
- Resolution.
- X–Y goes to Y, Y–Z to Z and Z–X to X: each goes to the later axis of its pair.
- In ISO 230-1's terms EB0Z is an error of the Z axis. Z already carries Y–Z and an axis takes one error, so EB0Z is placed as an error of X instead: the X slide, with the Y slide, the table and the part, turned about +Y by +55.85 µrad. In the part's coordinates that equals the Z travel and the tool axis turned about +Y by −55.85 µrad. For the cut, it is the same as a rotation of the opposite sign in front of Z, which is EB0Z ≈ −56 µrad in Holub's sign.
- The cost: on the canvas the table and the fixture lean by 56 µrad as well, too little to see. Y–Z tilts the Z travel together with the tool axis. With no spindle role, a tilt of the spindle itself (its tram) cannot be told apart from a tilt of the Z travel.
- Evidence. The affine fit's A[0][2] is −5.5851 × 10⁻⁵: going down, the tool moves ψ|Z| toward +X, and solving A for ψ gives 55.8505 µrad. The left and right faces slope with height (program Z, up positive) by +55.99 and −56.01 µm/m: the left is cut too deep and the right keeps material, with the predicted signs.
3. Pivots at the tool tip of the touch-off, so G54 stays as it is
- Situation. Where a static rotation's pivot sits decides how far the whole part shifts. A real
machine touches off on the part, and the
G54it finds includes the shift at the touch-off pose. HiNC's P0 measures on the nominal chain and includes nothing. - Risk. Left at the machine's origin, the pivots would shift the whole part: X–Y by +10.8 µm in Y, Y–Z by −15.6 µm in Y and Z–X by −26.3 µm in X (derived in the design). A touch-off would absorb these shifts and P0 does not, so the geometry difference would blame the errors for the missing touch-off.
- How noticed. While the design derived each error's offset at program zero.
- Resolution. All three pivots sit at the point where the tool tip stands at the touch-off pose,
with the tip at program zero and the machine at (−441, −291, −424): (0, 0, 471) in base coordinates,
(−441, 0, 471) in the X anchor's. The deviation at the touch-off point is then zero, the nominal
G54is what a real touch-off would measure, and the on runs need no typed work offset. - Evidence. The affine fit's offset at program zero is b = (−2.3 × 10⁻¹⁴, −1.9 × 10⁻¹⁷, 5.0 × 10⁻¹⁵) mm. Seen the other way, the steps that approach from machine zero at the start of the program (program X 441, Z 424 mm) put the tip (−23.7, −24.8) µm off, as the formula gives. A P0 measured that far from the touch-off point would be off by that much.
4. Whether a 0.25 mm grid can show a signal below 1 µm
- Situation. By the first-order formula, these squareness errors move this part's surfaces by about 1.7 µm at most. The Z tilts move them by under 1 µm and the floors by 0.2 µm. The voxel cell is 250 µm wide.
- Risk. If the grid could not show them, the errors would have to be enlarged, or only the tool tip reported. Enlarged, the numbers would no longer be the size of a real machine's errors.
- How noticed. A doubt of the design. The trial of the tools (RPTU part 4, with an X–Y squareness) had only shown the deviation staying proportional to the angle down to ±2.7 µm at 0.25 mm.
- Resolution. No enlargement: the errors at their real size, and a colour scale of ±0.002 mm. Before the plays, the design also set down a fallback: if the tool tip passed and the part did not, that would be written down as the mesh lacking sub-micrometre fidelity, not as the error model being wrong.
- Evidence. The grid shows them.
- The grid nodes of the block's four faces lie within −0.03…+0.02 µm of the first-order prediction, 1–99 % of them (F3 also has 39 vertices with the sign reversed; dilemma 7).
- On all fifteen wall boxes, the median of measured minus predicted is within ±0.003 µm.
- The three floor boxes agree with the swept flat end to 0.001 µm, and the boss's two-lobe coefficient c agrees with its prediction to 0.0001 µm.
- The three angles read back from the part are within 1 %.
5. A control run with no cut of its own
- Situation. Criterion 4 judges the control run by vertex distance: at least 99 % of the vertices within ±0.1 µm. When f-control played, the tool could not yet export a cut from a control run (that came later), so it has none.
- Risk. As written, the criterion cannot be judged. Without a noise floor, a micrometre-level difference cannot be told apart from the noise of the measurement.
- How noticed. In the analysis: the records hold no cut from the control run.
- Resolution. Three pieces of evidence take the place of the measurement, and the verdict says so:
- The control run's per-step series equals the nominal run's bit for bit (the same md5 of the uncompressed JSON); the differences in tip and machine coordinates are all zero.
- Its
Diff--Statsreport no NaN leaf. - The geometry-difference pictures of six views, read by hue: one degree of hue is 0.017 µm, 100 % of the pixels lie within ±0.05 µm, and the extremes read are −0.034 and +0.036 µm. A dark or anti-aliased pixel can be off by a few degrees.
- Evidence. The control run's series, its
Diff--Statsand the hue readings of every view, kept with the results.
6. Not every floor came out deeper: the raised side of a tilted flat end
- Situation. The design assumed that, with the tool axis tilted, every floor point is swept by the flat end's low edge, so the floors lie between 0 and −0.19 µm. F17, the 1 mm frame at Z−17 on the left, measured +0.061…+0.116 µm of material left instead. In the top view of the geometry difference, a faint cyan band also runs along the Z−9 floor outside the 30° square's front-left side.
- Risk. Dismissing it as noise or a mesh error, or else doubting the error model.
- How noticed. When the features were compared one by one, F17 was the only one outside the design's range; the band was seen in the top-view capture.
- Resolution. From the on run's own steps and the tilted flat end's bottom face, the analysis
computed the lowest point the bottom reached over every floor point (see the floors in the results).
- The frame floor lies at X1..2, and the cutter centre runs outside the part at X−1. So only the side of the bottom toward +X passes over it, which is the raised side, and material stays.
- Beside the 30° square's front-left side, only the side of the bottom facing the wall passes over the strip along the wall, and that is again the high side.
- Evidence. F17: predicted +0.087 µm, measured +0.088 µm (median), every vertex within 0.001 µm; F16 and F18 agree as well. The band's profile runs from +0.152 µm at 0.3–1 mm from the wall (the sweep gives +0.151) to −0.183 µm at 6–8 mm (the sweep gives −0.183).
7. Three artefacts of the vertex distance
- Situation.
- The largest vertex distance is +176.8 µm, a hundred times the 1.7 µm or so that these errors can cause at most. The 99th percentile of the 1 mm trimmed mesh is as much as 707 µm.
- 47 vertices of F2 and 39 of F3 have the right size and the wrong sign.
- The medians of F1 and F2 came out 0.09 and 0.13 µm smaller in size than the design's.
- Risk. Taking an artefact for the error (“0.18 mm of material left beside a convex edge”, “the model is 20 % off on the back face”), or letting the artefacts skew the statistics.
- How noticed. While summarising all vertices. The 1 mm mesh's 99th percentile was seen first when the plays ended, and was checked in the vertex data during the analysis.
- Resolution. Each was traced and handled on its own.
- A chamfer beside a convex edge. 682 vertices (0.36 %) lie more than 2 µm away. All of them are positive and all sit beside a convex edge: the tops of walls, the outer edge of the 1 mm frame, and the vertical corners of the block, the step and the 30° square. The largest, 0.17678 mm, is exactly 0.25 mm/√2. From that value and those places, the reading is that one of the two meshes keeps a sharp corner there where the other has a chamfer of about one cell. The 1 mm trimmed mesh's 99th percentile, 0.707 mm, is exactly 1 mm/√2, by the same mechanism: of its 455 vertices more than 0.01 mm away, 454 sit beside a convex edge. These vertices are in no feature box and no fit (the boxes keep clear of edges). The all-vertex percentiles include them; without them the 95th and 99th percentiles are +0.908 and +1.403 µm.
- Reversed signs. The 47 vertices of F2 and 39 of F3 read a distance equal to the prediction with the opposite sign. They gather in a few columns of vertices on seams of the nominal mesh (F3 at Y16, 20 and 37, for example). The distance takes its sign from one triangle of the nominal mesh, which is ambiguous at a seam. Medians and robust fits do not move; F3's 99th percentile does (+0.754 µm).
- Inserted vertices. Near where the deviation crosses zero, the exported mesh adds vertices between the 0.25 mm grid nodes: 366 on F1 and 1,177 on F2. They read closer to zero than the prediction, by up to 0.34 µm. The design took the middle of each face, as if the vertices were spread evenly. So the medians of F1 and F2 land at +0.409 and −0.443 µm rather than the design's values of +0.50 and −0.57. The per-vertex prediction over the same vertices gives +0.413 and −0.463 µm.
- Evidence. The analysis counts the artefacts and, for each feature, the reversed and inserted vertices. The grid nodes themselves lie within −0.03…+0.02 µm of the prediction (dilemma 4). Criterion 5 is judged on the robust fits; the ordinary least squares over all vertices is within the tolerance too.
Results and benefits
Measured on a HiNC 3.2.46 development build with error-term branches, physics off. “Measured” here means measured on HiNC's simulated results. The tool tip is the same at both grids; the part's numbers come from the 0.25 mm full runs.
| # | Verdict | Measured |
|---|---|---|
| 1 | met where measured; two items not checked | Chain: table side O→base→Xerr→X→Yerr→Y→w, tool side base→Zerr→Z→S→t. All three errors are marked, and the values read back from the saved project are those asked for: ZXsq (base→Xerr, 0.0032° about (0, 1, 0), pivot (0, 0, 471)), XYsq (X→Yerr, 0.0014° about (0, 0, 1), pivot (−441, 0, 471)), YZsq (base→Zerr, 0.0019° about (1, 0, 0), pivot (0, 0, 471)). The X, Y and Z axis branches now start from Xerr, Yerr and Zerr, still play Axis X, Y and Z, and keep their values; the three branches have new Guids, because their start anchors changed. The roles check was empty before and after the build; the base project loaded, and loaded again after Save As, with no message; the other four branches are unchanged. First item not checked: whether each axis kept its original transformer object, which the record cannot tell; only its name, values and role are the same. Second item not checked: whether the case's files outside the error-term folder stayed unchanged, for which there is no record |
| 2 | met | All six runs ended Finished with 192,851 steps. The last step is on line 11,892 (N59385 G53 G0 Z0.); the two lines after it, M30 and %, make no step. Of the 11,859 lines with a coordinate word, only 9 moves to where the tool already was have no step: line 10's G53 G0 Z0. at machine Z0 and 8 repeated Z15.. The records keep warnings and above: nc held three Parsing--Unconsumed a run; step and ncManip were empty, so there was no collision, stroke or Play-Touch message; shell held one Diff--TargetNotClosed in each of the four runs with a geometry difference, because the ideal geometry is an exported open mesh. Sys-Init--FileLines is below warning level, so the records do not show it, and the executed line count was not recorded: “all lines executed” rests on every line that moves the tool having steps |
| 3 | met | On the cutting steps (159,337 at 0.25 mm, 157,965 at 1 mm) the residual is at most 1.4 × 10⁻¹³ mm long, every component at most 1.24 × 10⁻¹³ mm; over all 192,851 steps, at most 1.55 × 10⁻¹³ mm long and 1.52 × 10⁻¹³ mm per component. A[0][2] = −5.5851 × 10⁻⁵, A[1][0] = −2.4435 × 10⁻⁵, A[1][2] = −3.3160 × 10⁻⁵, every other element at most 2.2 × 10⁻⁹ in size; at most 4.6 × 10⁻⁹ from the plan's A, which was written to four significant digits. b = (−2.3 × 10⁻¹⁴, −1.9 × 10⁻¹⁷, 5.0 × 10⁻¹⁵) mm. The machine coordinates of the on and nominal runs are the same bit for bit |
| 4 | not measured as written; met on the evidence that replaced it | The control run exported no cut (dilemma 5). Instead: its per-step series equals the nominal run's, the tip difference 0; no NaN leaf in its Diff--Stats; the geometry-difference pictures of six views read by hue, 100 % of the pixels within ±0.05 µm, the extremes −0.034 and +0.036 µm |
| 5 | met | Front F1 +24.39 and back F2 −24.45 µm/m (predicted ±24.43, tolerance ±3.67); left F3 +55.99 and right F4 −56.01 µm/m (predicted ±55.85, tolerance ±11.17). These are robust fits (see below); the ordinary least squares over all vertices gives +23.94, −24.86, +54.80 and −56.01 µm/m, also within the tolerances. c = −0.367 µm |
| 6 | met | 1 mm: 45.1 s and 0.88–0.96 GB a run; 0.25 mm: 85.1–95.1 s and 1.35–1.69 GB (see “What the runs cost”, below) |
The tool tip on every cutting step
Here the tool tip means each step's CL: the actual tip position in program coordinates. The on and
nominal runs have the same number of steps, so they can be lined up step by step and subtracted. A
cutting step is one on which the nominal run touches the stock (IsTouched).
| Comparison | Over | Result |
|---|---|---|
| On minus nominal, minus the exact δ | the 159,337 cutting steps at 0.25 mm | at most 1.24 × 10⁻¹³ mm per component (1.4 × 10⁻¹³ mm long) |
| The same | the 157,965 cutting steps at 1 mm | at most 1.24 × 10⁻¹³ mm per component (1.4 × 10⁻¹³ mm long) |
| The same | all 192,851 steps, the approach from machine zero included | at most 1.52 × 10⁻¹³ mm per component, 1.55 × 10⁻¹³ mm long |
| On minus nominal, the largest offset in X / Y / Z | cutting steps | 0.949 µm / 2.014 µm / 3.6 × 10⁻⁸ mm |
| On minus nominal | the steps approaching from machine zero (program X 441, Z 424 mm) | (−23.7, −24.8, 0) µm, as the formula gives |
| Machine coordinates, on minus nominal | every step | 0: the same bit for bit |
| Control minus nominal | every step | 0: the two series the same bit for bit |
- The largest X offset, 0.949 µm, is at the deepest level, Z−17 (ψ × 17 mm). The largest Y offset, 2.014 µm, is in the face milling at X 83.8, Z−1 (θ × 83.8 mm less φ × 1 mm).
- Fitting the cutting steps' offsets as δ = A·p + b, with p the nominal tool tip, gives A[0][2] = −5.5851 × 10⁻⁵, A[1][0] = −2.4435 × 10⁻⁵ and A[1][2] = −3.3160 × 10⁻⁵, with a fit residual of 1.4 × 10⁻¹³ mm and an offset b at program zero of the order of 10⁻¹⁴ mm. Solving A gives θ 24.4346, φ 33.1613 and ψ 55.8505 µrad: the values the build read back.
- The 1 mm and 0.25 mm step series are the same bit for bit apart from
IsTouched(compared as uncompressed JSON). The step count, the tool tip and the machine coordinates do not depend on the voxel grid, so 1 mm is enough to prove the per-step formula.IsTouchedrecords contact with the voxel stock, and it differs on 1,372 steps between the two grids.
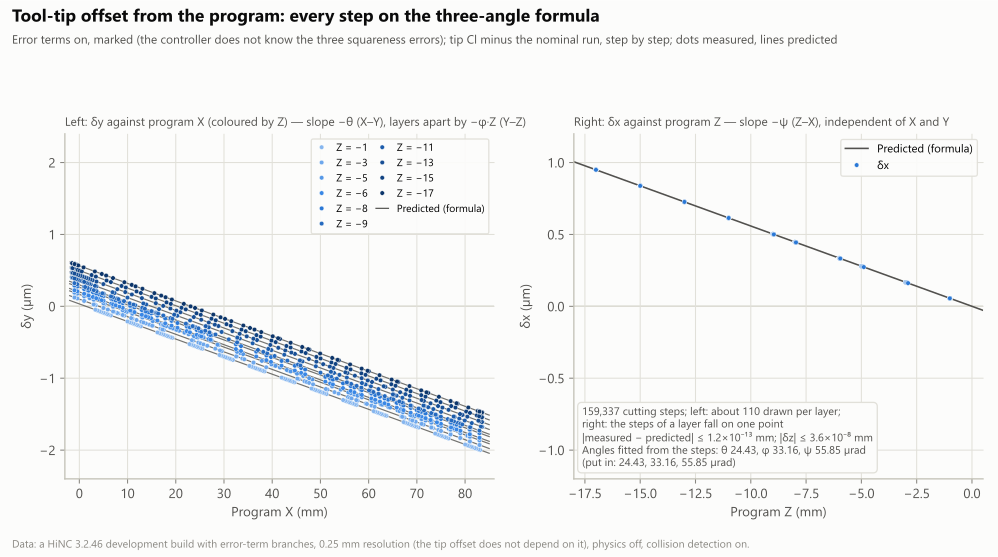
With the error terms on and the errors marked: the tool-tip offset of the 159,337 cutting steps (each step's CL minus the nominal run's, in program coordinates). Left, δy against program X, coloured by cutting height: the slope is −θ (X–Y, 24.43 µrad), and the heights lie −φ·Z apart (Y–Z, 33.16 µrad). Right, δx against program Z: the slope is −ψ (Z–X, 55.85 µrad), independent of X and Y. Dots are measured and lines the formula, within 1.2 × 10⁻¹³ mm; the angles fitted back from the steps are 24.43, 33.16 and 55.85 µrad. The vertical axes are symmetric. A HiNC 3.2.46 development build with error-term branches, 0.25 mm, physics off.
The part: every face against the nominal cut
How it was measured: the on run's exported cut has 190,615 vertices. Each one was given its signed distance d to the nominal cut: positive = material left, blue in the geometry difference; negative = cut too deep, red. HiNC's geometry difference gives the pictures and the counts; every deviation number comes from this measurement.
- All vertices: 1st percentile −1.144, 5th −0.815, median −0.181, 95th +0.929 and 99th +1.481 µm.
- The deepest over-cut, −1.640 µm, is at the +X end of the 78 mm block's back face, at its top edge (X79.75, Z−9.25; predicted −1.642). At the +X end of the 3° step's front face the material left is +1.676 µm (X79.75, Z−9.25; predicted +1.671). The most material left on a wall, +1.69 µm, is near the +X end of the 30° square's front-right side, 1.7 mm from its corner (X76.4, Z −5.25…−8.75), where the formula gives +1.64 µm. Three vertices on the convex top edge of the 30° square (Z−5) read more, 1.89–1.90 µm. They are above the 1.7 µm or so these errors can cause, so they too are convex-edge artefacts, just under the 2 µm cut-off.
- 682 vertices (0.36 %) lie more than 2 µm away. All of them are artefacts beside convex edges, and they are left out of every feature box and fit (the boxes keep clear of edges). The all-vertex percentiles above include them; without them the 95th and 99th percentiles are +0.908 and +1.403 µm (dilemma 7).
Family by family:
- The block's front face and the 3° face, facing −Y. The X–Y squareness moves the tool toward −Y as
it travels in X, away from the part, so the material left grows along X. Y–Z moves it toward +Y as it
goes down, into the part, so the whole face is cut φ·|z| deeper.
- F1 reads −0.305 µm at X6–8 and +1.332 µm at X74–76 (predicted −0.326 and +1.335).
- The 3° face, F5, reads −0.060 µm at X10–12 and +1.503 µm at X74–76.
- The block's back face, facing +Y (the 8 mm wall). Both effects change sign: F2 reads +0.252 µm at X6–8 and −1.404 µm at X74–76 (predicted +0.260 and −1.401). Front and back turn together and stay parallel, and the width does not change.
- The block's left and right faces, facing −X and +X. Z–X moves the tool toward +X as it goes down.
- The right face (X80, the 8 mm wall) keeps material, more the deeper it goes: +0.534 µm at Z−9.5 and +0.923 µm at Z−16.5.
- The left face (X2) is cut too deep: −0.754 µm at Z−13.5 and −0.921 µm at Z−16.5.
- Neither changes along Y (slopes +0.003 and −0.005 µm/m). The 93° face F6, the 3° step's left face, behaves the same way, with a median of −0.631 µm.
- The 30° square. Its sides face −60°, 30°, 120° and −150°. The X–Y effect scales with the normal's Y component, and each side's normal also decides how much of the two Z effects it takes. The front-right side (−60°) keeps the most material, median +1.183 µm; back right −0.364, back left −0.543 and front left −0.271 µm.
- The Ø54 boss. Front +0.898, back −0.893, right +0.183 and left −0.169 µm; the shape all the way round is in its own section below.
- The floors and the top face. The three floor boxes lie within −0.195…+0.116 µm (see the floors below).
- The uncut stock face (X1, Z−45…−20): 0.
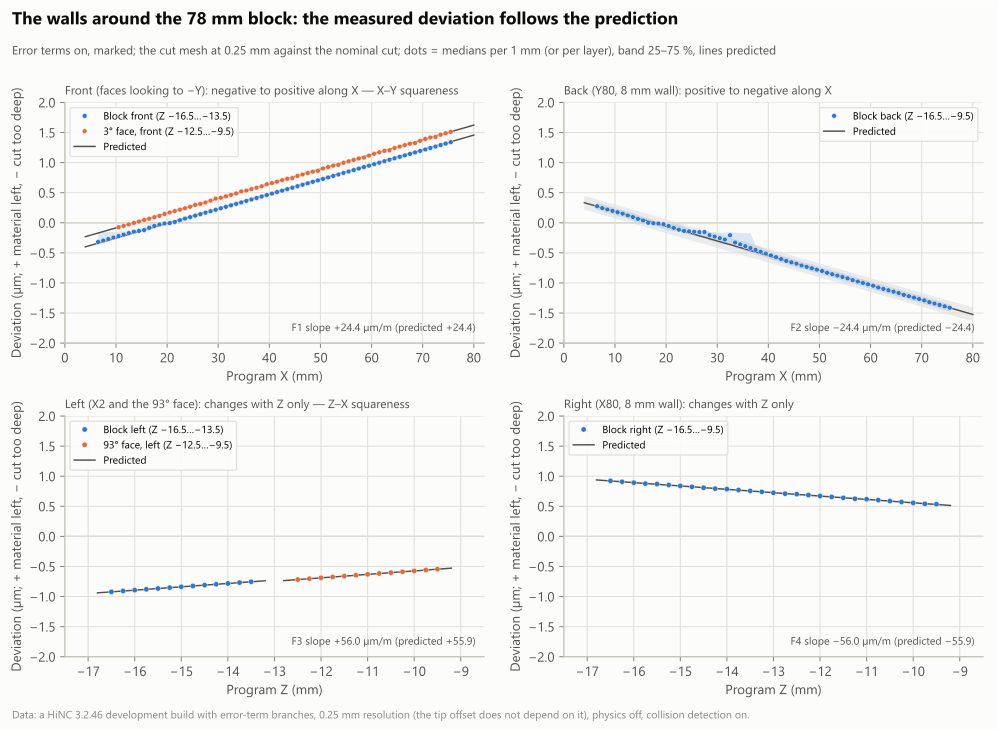
The walls around the 78 mm block, vertex distance against position, with the error terms on and the errors marked. The front (the block at Z −16.5…−13.5 and the 3° face at Z −12.5…−9.5) goes from negative to positive along X, F1 sloping +24.4 µm/m (predicted +24.4). The back 8 mm wall goes from positive to negative, −24.4 µm/m. The left face, with the 93° face, and the right face change with height only, sloping +56.0 and −56.0 µm/m against program Z, up positive (predicted ±55.9). Dots are the medians per 1 mm or per level, bands 25–75 %, lines the prediction. The vertical axis is symmetric, ±2 µm; negative = cut too deep, positive = material left. 0.25 mm; a HiNC 3.2.46 development build with error-term branches.
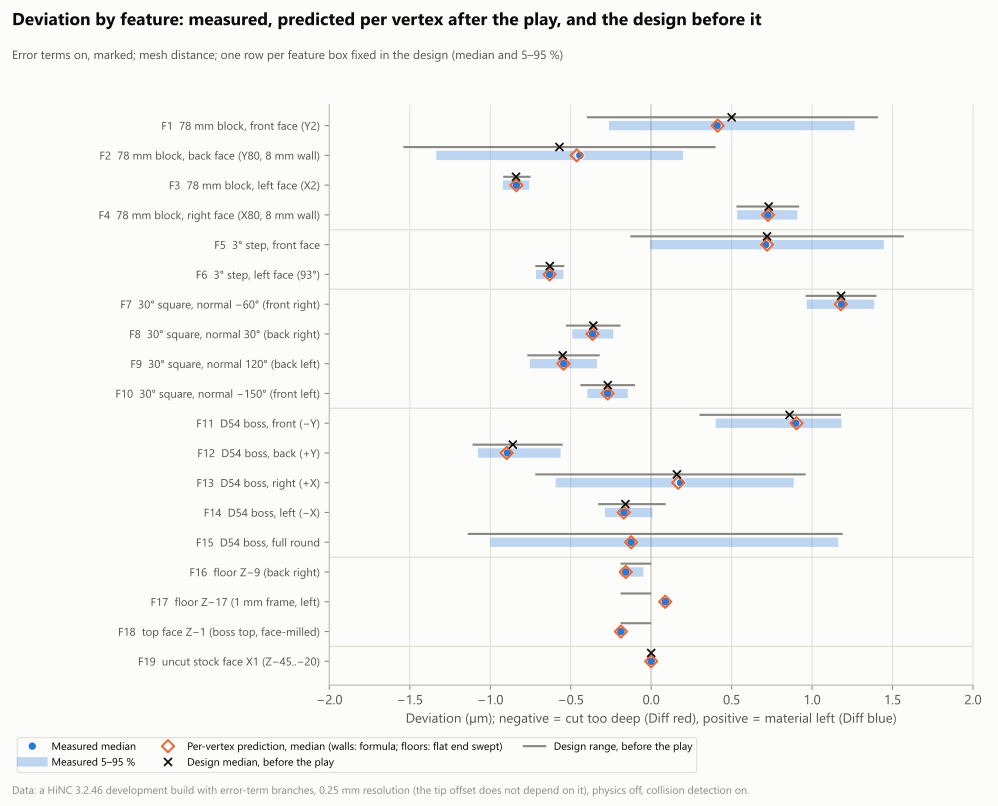
The nineteen feature boxes fixed in the design, with the error terms on and the errors marked. Each row shows the median vertex distance (blue dot) and its 5–95 % range (blue band); the per-vertex prediction computed after the play (orange diamond: the walls by the formula, the floors by sweeping the tilted flat end); and the median (black cross) and range (grey line) the design wrote before the play. The horizontal axis is symmetric, ±2 µm. On the walls, the median of measured minus predicted is within 0.003 µm; the F17 frame floor keeps +0.09 µm of material where the design wrote 0 to −0.19. 0.25 mm; a HiNC 3.2.46 development build with error-term branches.
The vertex distance in the nineteen feature boxes (µm)
The per-vertex prediction was computed after the play over the same vertices: the walls by the first-order formula above, the floors by the swept flat end. The design values were written before the play.
| Feature | Vertices | Measured: median (5–95 %) | Per-vertex prediction, median | Design, before the play | Measured minus predicted, median |
|---|---|---|---|---|---|
| F1 78 mm block, front face (Y2, Z −16.5…−13.5) | 4,040 | +0.409 (−0.262…+1.264) | +0.413 | +0.50 (−0.40…+1.41) | 0.000 |
| F2 78 mm block, back face (Y80, the 8 mm wall) | 9,385 | −0.443 (−1.335…+0.198) | −0.463 | −0.57 (−1.54…+0.40) | −0.001 |
| F3 78 mm block, left face (X2) | 3,653 | −0.838 (−0.921…−0.758) | −0.838 | −0.84 (−0.92…−0.75) | 0.000 |
| F4 78 mm block, right face (X80, the 8 mm wall) | 7,801 | +0.725 (+0.534…+0.908) | +0.726 | +0.73 (+0.53…+0.92) | −0.003 |
| F5 3° step, front face | 3,628 | +0.711 (−0.008…+1.446) | +0.720 | +0.72 (−0.13…+1.57) | 0.000 |
| F6 3° step, left face (93°) | 3,848 | −0.631 (−0.716…−0.546) | −0.631 | −0.63 (−0.72…−0.54) | 0.000 |
| F7 30° square, side with normal −60° (front right) | 1,807 | +1.183 (+0.967…+1.386) | +1.179 | +1.18 (+0.96…+1.40) | −0.001 |
| F8 30° square, normal 30° (back right) | 1,807 | −0.364 (−0.489…−0.236) | −0.364 | −0.36 (−0.53…−0.19) | −0.001 |
| F9 30° square, normal 120° (back left) | 1,807 | −0.543 (−0.754…−0.337) | −0.545 | −0.55 (−0.77…−0.32) | 0.000 |
| F10 30° square, normal −150° (front left) | 1,807 | −0.271 (−0.397…−0.145) | −0.271 | −0.27 (−0.44…−0.10) | 0.000 |
| F11 Ø54 boss, front (−Y) | 1,885 | +0.898 (+0.401…+1.183) | +0.903 | +0.86 (+0.30…+1.18) | +0.001 |
| F12 Ø54 boss, back (+Y) | 1,859 | −0.893 (−1.077…−0.563) | −0.898 | −0.86 (−1.11…−0.55) | +0.002 |
| F13 Ø54 boss, right (+X) | 1,885 | +0.183 (−0.594…+0.886) | +0.168 | +0.16 (−0.72…+0.96) | 0.000 |
| F14 Ø54 boss, left (−X) | 1,859 | −0.169 (−0.287…+0.008) | −0.170 | −0.16 (−0.33…+0.09) | 0.000 |
| F15 Ø54 boss, full round | 11,232 | −0.125 (−1.000…+1.163) | −0.125 | range −1.14…+1.19 | +0.001 |
| F16 floor Z−9 (back right) | 1,621 | −0.158 (−0.193…−0.048) | −0.158 (swept) | −0.19…0 | 0.000 |
| F17 floor Z−17 (1 mm frame, left) | 723 | +0.088 (+0.061…+0.116) | +0.087 (swept) | −0.19…0 | 0.000 |
| F18 top face Z−1 (boss top, face-milled) | 7,921 | −0.188 (−0.193…−0.179) | −0.188 (swept) | −0.19…0 | 0.000 |
| F19 uncut stock face X1 (Z−45…−20) | 54 | 0 (0…0) | — | 0 | — |
The three angles read back from the part
This is criterion 5. Each face's vertices are fitted as d = a·s + b·z + c, where s is the position along the face. A slope is an angle (1 µm/m = 1 µrad):
| Face | Fit | Robust fit | Least squares, all vertices | Predicted | Angle read |
|---|---|---|---|---|---|
| F1 block front | along X | +24.39 µm/m | +23.94 µm/m | +24.43 µm/m | θ 24.39 µrad |
| F2 block back | along X | −24.45 µm/m | −24.86 µm/m | −24.43 µm/m | θ 24.45 µrad |
| F1 block front | with Z | +33.41 µm/m | +31.78 µm/m | +33.16 µm/m | φ 33.41 µrad |
| F2 block back | with Z | −32.91 µm/m | −32.46 µm/m | −33.16 µm/m | φ 32.91 µrad |
| F3 block left | with Z | +55.99 µm/m | +54.80 µm/m | +55.85 µm/m | ψ 55.99 µrad |
| F4 block right | with Z | −56.01 µm/m | −56.01 µm/m | −55.85 µm/m | ψ 56.01 µrad |
- Put in: θ 24.43, φ 33.16 and ψ 55.85 µrad. The six values read back from the cut part are all within 1 %.
- The robust fit drops the vertices whose residual is larger than max(4 × 1.4826 × MAD, 0.02 µm) and fits again. It drops 258 of F1's 4,040 vertices, 1,092 of F2's 9,385, 39 of F3's 3,653 and none of F4's.
- The plan's tolerances are ±15 % (±3.67 µm/m) on the front and back faces and ±20 % (±11.17 µm/m) on the left and right; both fits are within them.
The Ø54 boss: an offset centre plus two lobes
The 11,232 vertices of the boss wall (Z −4.5…−1.5) are fitted as d(α) = a·cos α + b·sin α + c·sin 2α + e·cos 2α + f, where α is the azimuth about the boss centre (41, 41), with 0° toward +X and 90° toward +Y.
| Coefficient | Measured | Predicted (closed form, after the play) | Plan |
|---|---|---|---|
| a (centre toward +X) | +0.169 µm | +0.168 µm | +0.17 µm |
| b (centre toward +Y) | −0.902 µm | −0.902 µm | −0.90 µm |
| c (two lobes) | −0.367 µm | −0.367 µm | −0.37 µm |
| e | +0.0004 µm | 0 | 0 |
| f (change of radius) | +0.002 µm | 0 | 0 |
- The centre moved by (+0.169, −0.902) µm, 0.918 µm in all. The cutter-centre circle is centred at X41. X–Y moves it θ × 41 mm = 1.00 µm toward −Y, and at Z−3 Y–Z brings it 0.10 µm back. Z–X moves it ψ × 3 mm = 0.17 µm toward +X.
- With the centre removed, two lobes. The long axis lies at −44.97° / 135.03°, and the two-lobe roundness 2√(c² + e²) is 0.733 µm (0.742 µm computed directly from the medians per 2°). The fit leaves an rms residual of 0.048 µm.
- The lobes follow the radius of the cutter-centre path.
2D-KONTUR1moves the cutter centre on a circle of 30 mm radius (N17640 G2 X71. I30.), soc = −θ·R_c/2= −θ × 15 mm. The boss's 27 mm would have given −0.33 µm.
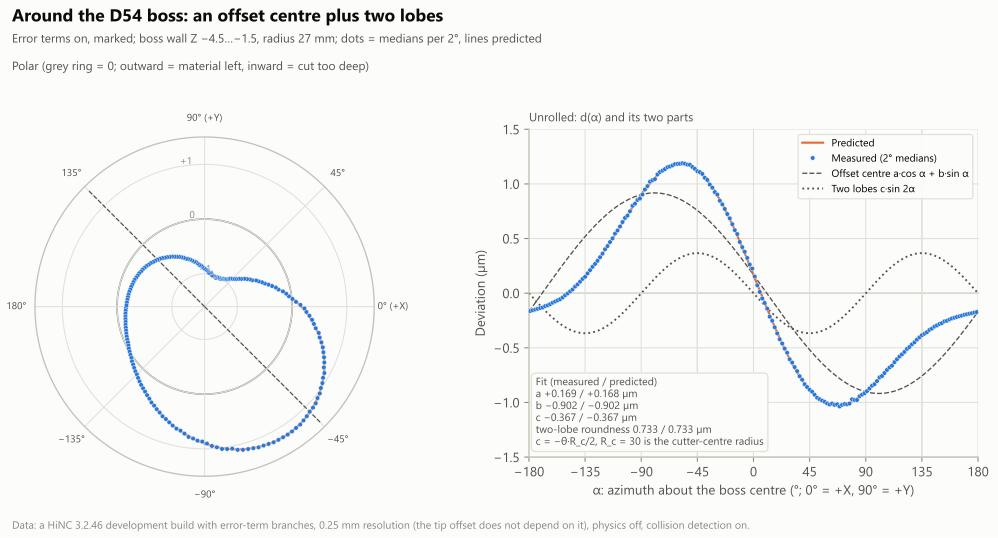
The deviation once around the Ø54 boss wall (Z −4.5…−1.5), as a CMM would trace it. Left, polar (grey ring = 0; outward = material left, inward = cut too deep); right, unrolled as d(α) and split into the offset-centre and two-lobe parts. The centre moved by (+0.17, −0.90) µm. With the centre removed, two lobes remain with their long axis at −45° / 135°: c = −0.367 µm, as predicted, and the two-lobe roundness is 0.733 µm. The lobes follow the 30 mm radius of the cutter-centre path, not the boss's 27 mm. Dots are medians per 2°, lines the prediction. 0.25 mm; a HiNC 3.2.46 development build with error-term branches.
Read like a CMM: ISO 10791-7-style indicators
Each face's fit gives its turn and its lean. Datum B is the 78 mm block's front face; the numbers are µm over the length named:
| Indicator | Measured | Predicted | What it says |
|---|---|---|---|
| 78 mm block, left face turned against B (over 78 mm) | +1.903 | +1.906 | the front-left corner above 90°: the X–Y squareness θ × 78 mm |
| 78 mm block, back face against B (parallelism, over 78 mm) | −0.005 | 0 | front and back turn together and stay parallel |
| Change of width: front to back (X41, Z−15) / left to right (Y41, Z−15) | −0.006 / −0.009 | 0 / 0 | the block becomes a parallelogram with its sides unchanged |
| 3° step, front face against B (over 74 mm) | +0.002 | +0.005 | it turns with B |
| 93° face against B (over 78 mm) | +1.900 | +1.903 | as the block's left face |
| 30° square, the four sides against B (over 54 mm; normals −60° / 30° / 120° / −150°) | +0.331 / +0.989 / +0.325 / +0.984 | +0.33 / +0.99 / +0.33 / +0.99 | the sides with normals −60° and 120° turn by θ/4 against B, the other two by 3θ/4 |
| 30° square, the four corners (over 54 mm; front right–back right / back right–back left / back left–front left / front left–front right) | −0.658 / +0.663 / −0.659 / +0.653 | −0.66 / +0.66 / −0.66 / +0.66 | the angle between neighbouring sides changes by θ/2 only |
| Lean of the right 8 mm wall (negative = top edge inward) | −0.448 | −0.447 | Z–X: ψ × 8 mm |
| Lean of the back 8 mm wall | −0.263 | −0.265 | Y–Z: φ × 8 mm |
| Ø54 boss, centre toward +X / +Y | +0.169 / −0.902 | +0.168 / −0.902 | see the boss above |
| Ø54 boss, two-lobe roundness | 0.733 | 0.733 | θ × 30 mm, twice the size of c |
All 19 indicators lie within 0.009 µm of their predictions.
Background, not a pass mark: the same θ over a 320 mm edge of the ISO 10791-7 test piece comes to 7.82 µm. Renishaw's white paper TE336 converts ISO 10791-7's squareness tolerance for the 320 mm test piece, 0.020 mm, to 62.5 µrad. This machine's X–Y squareness is about 39 % of that (read by the designer agent from TE336, p. 9). Part 8 is the 80 mm version, and no tolerance for that size was at hand, so this is background only.
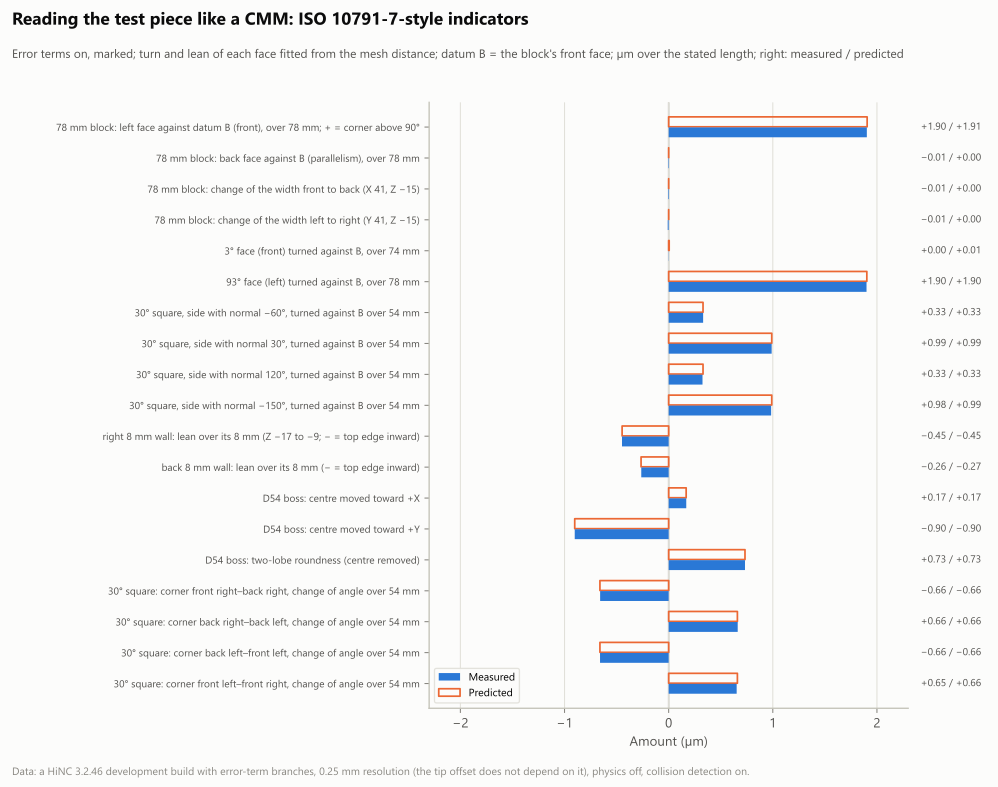
The test piece read like a CMM, with the error terms on and the errors marked: each face's turn and lean fitted from the vertex distance, datum B the block's front face. Blue is measured, the orange outline predicted, and the right-hand column gives measured / predicted. The left face is turned +1.90 µm over 78 mm against B (the front-left corner above 90°). The back stays parallel to B, and the widths front to back and left to right do not change. Each corner of the 30° square changes by ±0.66 µm over 54 mm. The 3° face turns with B, and the 93° face by +1.90 µm. The 8 mm walls lean −0.45 µm (right) and −0.26 µm (back). The boss's centre moved (+0.17, −0.90) µm and its two lobes are 0.73 µm. The horizontal axis is symmetric, ±2 µm. 0.25 mm; a HiNC 3.2.46 development build with error-term branches.
The floors and the top face: a tilted flat end
The tool axis tilts with the Z travel by about 65 µrad (axis direction (−5.585 × 10⁻⁵, −3.316 × 10⁻⁵, 1)). The high side of its bottom faces the azimuth 30.7°, between +X and +Y. So the Ø6 flat end's bottom stands higher on one side than on the other, by up to ±3 mm × 65 µrad ≈ ±0.19 µm. Where a floor point ends up depends on which side of the bottom passed lowest over it, among the steps that swept it.
The analysis takes every step of the on run and computes, point by point, the lowest position at which the bottom of the flat end passed over each floor point (below, “the swept flat end”). It then compares that with the mesh:
| Floor | Measured: median (5–95 %) | Swept flat end | Residual per point |
|---|---|---|---|
| F16, Z−9 floor (back right) | −0.158 (−0.193…−0.048) µm | −0.158 µm | ≤ 0.001 µm |
| F17, Z−17, the 1 mm frame (left) | +0.088 (+0.061…+0.116) µm | +0.087 µm | ≤ 0.001 µm |
| F18, boss top Z−1 (face-milled) | −0.188 (−0.193…−0.179) µm | −0.188 µm | 0.000 µm |
- F17 keeps material, against the design's 0 to −0.19. The frame floor lies at X1..2 and the cutter centre runs outside the part at X−1, so only the side of the bottom toward +X passes over it: the raised side (dilemma 6).
- The faint cyan band in the top view. On the Z−9 floor outside the 30° square's front-left side (normal −150°), a faint cyan band runs along the wall. The same sweep gives its profile:
| From the wall | Vertices | Measured (median) | Swept flat end |
|---|---|---|---|
| 0.3–1 mm | 480 | +0.152 µm | +0.151 µm |
| 1–2 mm | 687 | +0.095 µm | +0.096 µm |
| 2–3 mm | 911 | +0.020 µm | +0.020 µm |
| 3–4 mm | 682 | −0.034 µm | −0.034 µm |
| 4–6 mm | 1,319 | −0.129 µm | −0.130 µm |
| 6–8 mm | 1,115 | −0.183 µm | −0.183 µm |
The strip next to the wall is passed over only by the side of the bottom that faces the wall, toward +30°, which is the high side; 6–8 mm away, the low side of other passes sweeps it. The residual of these 5,194 vertices is within 0.001 µm, 1–99 % of them.
Marked and unmarked
This case has no unmarked run. 8.ngc is a plain three-axis program: G54 and G43 H1, no G43.4,
no G68.2, and not CL. Its machine coordinates follow from the program and the work offset alone.
Whether the controller knows the three squareness errors or not, it computes the same machine
coordinates, and the errors are cut into the part either way. An unmarked run's tool tip and cut would
be the same as the on run's, bit for bit; that follows from the design, and no run was played to check
it.
The one thing that would differ is P0. With the marks cleared, P0 would be measured on the chain with
its errors, at machine zero (program X 441, Z 424 mm), where the tool tip is off by (−23.7, −24.8) µm
as measured above. The design estimates that this would put G54 off by 10 to 25 µm. A real machine
touches off on the part and has no such offset, so this is listed under the limits rather than played
as another run.
The control run and the comparison pictures
The control run (switch off, with the geometry difference) is the nominal run played again. Its per-step series equals the nominal run's bit for bit (the same md5 of the uncompressed JSON), and the differences in tip and machine coordinates are all zero. It exported no cut, so its noise floor is read from the pictures (dilemma 5):
- On the Df colour bar, blue is +0.002 mm, green 0 and red −0.002 mm; one degree of hue is 0.017 µm.
- In all six views, 100 % of the pixels lie within ±0.05 µm; the extremes read are −0.034 and +0.036 µm.
Each of the six pictures below alternates, in place and at one camera, between the error terms on (marked) and off (control), 0.9 s a frame.
- The pictures come from putting each run's recorded stock back on the canvas with its geometry difference. Nothing was played again.
- The cameras are HiNC's default views, zoomed with the mouse wheel.
- The four side views are cropped to the four machined levels, with a strip of the uncut stock below as a green reference.
- The canvas shows no interface text, so the English and Chinese canvas captures are identical pixel for pixel. Only the labels follow the language.
The geometry difference from the front (the faces looking toward −Y), alternating in place between error terms on (marked) and off (control). With the error terms on, the block's front face and the 3° face turn from yellow-green at the left end (X6–8, about −0.3 µm) to cyan and blue at the right end (X74–76, +1.33 to +1.50 µm): the X–Y squareness makes the deviation grow along X. The front-right side of the 30° square is cyan to blue all over (+1.18 µm) and the boss's front half cyan (+0.90 µm); the dark patches at the left are faces seen at a grazing angle. With the error terms off, everything is green. Colour scale ±0.002 mm (red = cut too deep, blue = material left, green = 0, both signs weighted alike); 0.25 mm; a HiNC 3.2.46 development build with error-term branches.
The geometry difference from the back (the faces looking toward +Y; +X is at the left of the picture), alternating in place. With the error terms on, the block's back 8 mm wall turns from orange-red at the +X end (X74–76, −1.40 µm) to green at the −X end (X6–8, +0.25 µm), the opposite sign of the front; the boss's back half is yellowish (−0.89 µm). With the error terms off, everything is green. Scale, grid and build as above.
The geometry difference from the right (the faces looking toward +X), alternating in place. With the error terms on, the right 8 mm wall is cyan-green to cyan all over, bluer lower down (+0.53 µm at Z−9.5, +0.92 µm at Z−16.5) and the same along Y: the Z–X squareness changes with depth only. With the error terms off, everything is green. Scale, grid and build as above.
The geometry difference from the left (the faces looking toward −X), alternating in place. With the error terms on, the block's left face and the 93° face are yellow-green all over (medians −0.84 and −0.63 µm, cut too deep), the same along Y and of the opposite sign to the right face. With the error terms off, everything is green. Scale, grid and build as above.
The geometry difference from the top, alternating in place. With the error terms on, the floors and the top face are almost all green: the tilted flat end moves them by a few tenths of a micrometre at most, and the walls are thin lines seen from above. The faint cyan band at the lower left, along the 30° square's front-left side, is material left on the Z−9 floor. Only the raised side of the flat end swept the strip next to the wall: +0.15 µm within 1 mm of the wall, turning to −0.18 µm 6–8 mm away. With the error terms off, everything is green. Scale, grid and build as above.
The geometry difference in the isometric view (from the front left, above), alternating in place. With the error terms on, the front faces at the lower right turn bluer toward +X and the left faces at the lower left are yellowish; the floors above are green. With the error terms off, everything is green. Scale, grid and build as above.
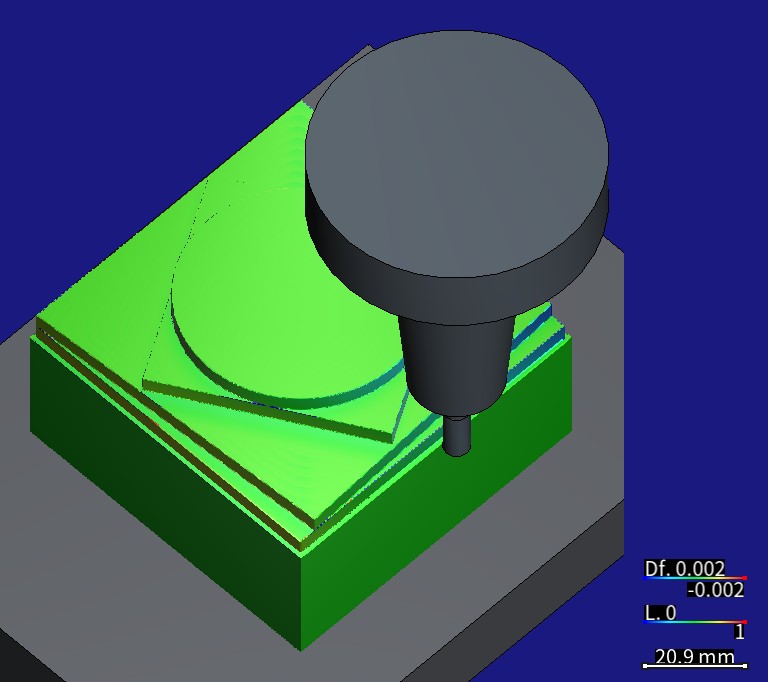
The same parked pose seen from the front left, above: the Ø6 flat end mill and its shrink-fit holder stand in the air outside the 78 mm block's front face and cut nothing. Scale, grid and build as above.
Diff--Stats of the four runs with a geometry difference
| Run | Reported leaves | Surface leaves before comparison | Expanded on demand | New nodes | NaN leaves | Measured wires | Unmeasured wires | Target triangles |
|---|---|---|---|---|---|---|---|---|
| t-on | 90,282 | 22,491 | 22,230 | 90,021 | 12 | 347,149 | 1,311 | 40,604 |
| t-control | 87,608 | 22,488 | 21,376 | 86,496 | 0 | 324,217 | 341 | 40,604 |
| f-control | 202,962 | 202,954 | 10 | 18 | 0 | 739,704 | 411 | 372,994 |
| f-on | 190,427 | 189,734 | 304 | 997 | 24 | 735,749 | 2,509 | 372,994 |
The nominal runs make no geometry difference. The target triangles are fewer than the exported STL holds, 372,994 against 374,191 at 0.25 mm (1,197 fewer) and 40,604 against 40,625 at 1 mm (21 fewer); this was not followed up. The on run has more NaN leaves (24, that is 0.013 %) and unmeasured wires (2,509, that is 0.34 %) than the control run (0 and 411); this was not followed up either.
What the runs cost
All runs used a private instance of a HiNC 3.2.46 development build with error-term branches, on the shared 32-thread server, with physics off and collision detection on:
| Play | Grid | Steps | Wall time | Peak memory (VmHWM) |
|---|---|---|---|---|
| t-nominal | 1 mm | 192,851 | 45.1 s | 0.88 GB (0.82 GiB) |
| t-on | 1 mm | 192,851 | 45.1 s | 0.96 GB (0.89 GiB) |
| t-control | 1 mm | 192,851 | 45.1 s | 0.88 GB (0.82 GiB) |
| f-nominal | 0.25 mm | 192,851 | 85.1 s | 1.35 GB (1.26 GiB) |
| f-control | 0.25 mm | 192,851 | 90.1 s | 1.46 GB (1.36 GiB) |
| f-on | 0.25 mm | 192,851 | 95.1 s | 1.69 GB (1.57 GiB) |
- Peak memory. The six plays queued one at a time on the lock the studies share, and the instance was restarted before each one, so each VmHWM is that play's own peak. GB = bytes ÷ 10⁹; GiB = bytes ÷ 2³⁰.
- Wall time runs from the start of the play to the poll that read
Finished, so it includes the geometry difference and the export after the play. The status was polled every 5 s, so a wall time can be up to 5 s late. - In all, the six plays took 405.6 s, about 6.8 minutes. The design estimated 25–35 s and 1.5–2 GB a play at 1 mm, and 60–90 s at 0.25 mm, plus 20–60 s for the geometry difference and about 10 s for the export, at 2–2.5 GB. The 1 mm plays came out slower than estimated (45.1 s), and every play used less memory than estimated. The design's stop rules, a 0.25 mm play longer than 10 minutes or a peak memory above 8 GB, were never reached.
- The pictures replay nothing. A recorded stock goes back on the canvas with its geometry difference; for the two holder pictures, a parking program moves the tool in the air only.
- Other load. The records cannot tell whether other work on the server was playing at the same time, so the wall times may include that load.
What it means
For a machining engineer.
- A machine that is “reasonably well calibrated”, with three squareness errors of 24–56 µrad, leaves at most about 1.7 µm on an 80 mm test piece. The front keeps material, more toward +X; the back is cut too deep, more toward +X; the left is cut too deep and the right keeps material; the 30° square's front-right side keeps the most (a median of +1.18 µm).
- A squareness's effect is the angle times the travel a feature spans. The same X–Y squareness comes to 7.82 µm over a 320 mm edge; the two Z squareness errors need a deep part to show.
- The touch-off point is the zero of the deviation: here the touch-off was at program zero, so that point does not move, and the farther a point lies from it in X or in depth, the more it moves.
- In HiNC, a machine's measured constant errors can go into its model. Their shape and size on your own part then show before the part is cut.
For a teacher or a student.
- Why the ISO 10791-7 test piece has a square, a square turned 30°, a circle and a 3° face at once. Under the same X–Y squareness, the block's corner takes the full θ, the corners of the 30° square change by θ/2, the circle becomes two lobes with their long axis on the −45°/135° diagonal, and the 3° face turns with the datum and keeps its angle.
- How the tool-tip offset follows from the machine chain, and why it does not depend on Y; why the circle's two lobes follow the 30 mm radius of the cutter-centre path, not the boss's 27 mm.
- A tool axis tilted by 65 µrad leaves a flat-end floor only 0.2 µm off, and which side of the end passed over a point decides the sign.
For someone weighing the approach.
- Cost. The six plays took 405.6 s of server time and at most 1.69 GB of memory. The build took about 1 s more; putting the stocks back and taking the pictures are not counted.
- Predictions. The formula and the design values were written before the plays:
- The per-step tool tip matches the exact formula to within 1.24 × 10⁻¹³ mm per component.
- The medians of F1–F14 come within 0.13 µm of the design.
- Applied vertex by vertex to the same vertices after the plays, the same formula brings the F1–F14 medians within 0.02 µm, and the 19 ISO-style indicators lie within 0.009 µm of the prediction computed after the plays.
- Misses. Where the predictions missed, the page says what was measured: the F17 frame floor keeps material where the design said 0 to −0.19; the F1 and F2 medians depart from the design because the mesh's vertices are not spread evenly; and the control run was judged on other evidence.
Honest limits
- Three squareness errors only, and constant ones. A real machine also has errors that vary with position, such as positioning and straightness errors, and backlash, servo mismatch and thermal growth. An error term holds only a constant error (a squareness, the tilt of an axis, a rotary axis' location, a spindle's tilt, an offset of machine zero), so none of those fit (Machine Geometric Error).
- The values are read off a chart, and the signs are inferred. Holub's Fig. 6 prints no numbers; ±1–2 µrad is the reading error, and the values went in rounded to 0.0001°. The paper states no sign rule. The signs here follow the right-hand rule; if they were the other way round, material left and over-cut would swap on every face at the same size. What this case measures is the model as designed, not the signs of that machine.
- The machine is not Holub's. The skeleton machine borrows only the three angles; the table, the travels and the set-up are the RPTU case's.
- The Z tilt goes with the tool axis. The skeleton machine has no spindle role bound, so a tilt of the spindle itself (its tram) cannot be told apart from a tilt of the Z travel. Z–X sits on the table side, so on the canvas the table and the fixture lean by 56 µrad as well, too little to see.
- A plain three-axis program, so no unmarked run. The errors are cut in, marked or not; this case cannot show how much a controller that knows them could take back.
- The touch-off is modelled by where the pivots sit. HiNC's P0 measures on the nominal
chain. This case puts the three pivots at the touch-off point, so the nominal
G54equals what a real touch-off would find. With another touch-off point, a corner of the stock for example, the pivots have to be computed again. - Geometry only. Physics was off, so there is no cutting force and no deflection.
- The vertex distance has artefacts (dilemma 7).
- The cause of the convex-edge artefacts, a sharp corner in one mesh and a chamfer of one cell in the other, is inferred from the largest value equalling 0.25 mm/√2 and from where they are; it was not checked point by point. The reversed signs are inferred from their pattern too; the nominal STL was not at hand in the analysis.
- “About 1.7 µm at most” is the first-order formula over the part; treating every vertex beyond 2 µm as an artefact rests on it.
- The 1 mm trimmed mesh has 7 more vertices beyond 2 µm that do not sit beside a convex edge: one at (13, 80, −9.58) reading 0.30 mm, and six on the boss at X68 reading 9.9 µm. They appear only in the trimmed mesh and were not traced.
- The control run has no cut of its own. Its noise floor is judged on three other pieces of evidence (dilemma 5). One degree of hue on the screen is 0.017 µm, and a dark or anti-aliased pixel can be off by a few degrees.
- Criterion 5 is judged on robust fits. The rule for dropping vertices was chosen during the analysis; the ordinary least squares over all vertices is within the tolerances too.
- Gaps in the records.
- Messages below warning level,
Sys-Init--FileLinesamong them, and the executed line count were not recorded. - Whether the case's files outside the error-term folder stayed unchanged has no record.
- “Bound again to the original objects” shows only as the same names, values and roles.
- Messages below warning level,
- Observations not followed up.
- f-on marks 160,714 steps as touching the stock, 1,377 more than the nominal run, and every one of them is a step that touches in the on run and not in the nominal one. The 1 mm t-on marks 681 fewer instead, and 2,591 steps differ between those two runs.
- The geometry difference counts fewer target triangles than the STL holds, and the on run has more
NaN leaves and unmeasured wires than the control (the
Diff--Statsabove).
- The ISO comparison stops at the shape. Unlike the ISO test piece, part 8 has no centre hole and no corner holes, so a real CMM would have no datum for the boss's centre shift. ISO 10791-7's tolerance is for the 320 mm test piece: background here, not a pass mark.
- Wall times are polled every 5 s, so they can be up to 5 s late.
What a reader can take to their own case
- Put each measured constant error on a branch of its own, directly upstream of the axis it belongs to. Keep the axis' own motion, its values and its role as they were, and read the chain back after the build (Where an Error Term Goes).
- Put a static error's pivot where the tool tip stands at the touch-off. The deviation is then zero at the touch-off point, and the nominal work offset is the one a real touch-off would find. If the touch-off is made elsewhere, compute the pivot again, or type in the work offset the shop measured (Program Zero Alignment).
- Make the nominal cut the ideal geometry. Then the geometry difference shows the error, not the toolpath's own marks.
- Predict before the first play, and check the tool tip first. The per-step tip against an exact formula is the most sensitive check, here to 10⁻¹³ mm. It does not depend on the grid: a 1 mm run proves it, and the fine grid is for the part and the pictures.
- Read the part like a test piece. The slopes and turns of fitted faces give the angles back; a circle's two lobes follow the radius of the cutter-centre path, not the part's.
- Expect the angle times the travel. A squareness shows on features that span a long travel; a Z squareness needs a deep part.
- Read vertex distances on boxes clear of the edges, with medians and robust fits. Beside convex edges, at mesh seams and at inserted vertices the distance can mislead; beside an edge, by up to a cell ÷ √2.
- Give the control run an exported cut of its own, so that the noise floor is measured the same way as the error.
- On a plain three-axis program a mark changes nothing in the cut: every error in the chain is cut into the part. A run with the marks cleared differs only under RTCP, a tilted plane or CL playback (What a mark changes).
Source and licence
The part, its program and its rendering. M. Schmitz, J. Mertes, F. Schillinger, M. Wagner,
Benchmark Dataset of 10 Multi-Feature Models for Single-Setup 3-Axis Milling, Zenodo, version 1,
published 2025-09-02, https://doi.org/10.5281/zenodo.17035762 (record:
https://zenodo.org/records/17035762). The record gives no affiliation for its authors; its contact is
at RPTU Kaiserslautern-Landau. Part 8 is the benchmark part of Mertes et al. (2024),
https://doi.org/10.1016/j.dte.2024.100024, which the record describes as based on ISO 10791-7; the
authors' model and programme are used as published, not any drawing from the standard. Search terms if
the link moves: Benchmark Dataset of 10 Multi-Feature Models for Single-Setup 3-Axis Milling,
zenodo 17035762.
Licensed under Creative Commons Attribution 4.0 International. The record's description says:
License: This dataset is distributed under the Creative Commons Attribution (CC-BY) license. The data may be freely used, modified, and shared, provided that the original authors are properly credited.
The attribution line the base case gives:
Model, NC program and rendering: M. Schmitz, J. Mertes, F. Schillinger, M. Wagner, “Benchmark Dataset of 10 Multi-Feature Models for Single-Setup 3-Axis Milling”, part 8, https://doi.org/10.5281/zenodo.17035762, licensed CC BY 4.0 (https://creativecommons.org/licenses/by/4.0/), provided without warranty. The simulation set-up (stock, placement, machine, spindle, tool geometry, holder, material) was derived or chosen by us; the model and the NC program are unchanged.
What was changed: the model, the NC program and the rendering are unchanged. The stock is 80 × 80 × 51 mm instead of the stated 80 × 80 × 50 mm, because the program faces 1 mm off the top of a model that is 50 mm tall below that face. The set-up (placement, material, machine, tool geometry, holder, spindle) is the agent's, as the page of parts 4–10 describes. This page adds three marked error-term branches to the machine: the agent chose their places, signs and pivots, and their values are read from Holub et al. (2020). This page does not reproduce the data set's rendering. This site offers no download; fetch the files from the record.
The three squareness values. M. Holub, R. Jankovych, J. Vetiska, J. Sramek, P. Blecha, J. Smolik,
P. Heinrich, “Experimental Study of the Volumetric Error Effect on the Resulting Working
Accuracy—Roundness”, Applied Sciences 10(18), 6233 (2020), https://doi.org/10.3390/app10186233.
Used: the LTc1 bars of Fig. 6 on p. 8, EC0Y about +24, EA0Z about +33 and EB0Z about −56 µrad, read
off the chart; and the X–Y squareness the ballbar measured, 22.4 µm/m, in Table 8 on p. 9. Search terms
if the link moves: app10186233, or the title.
The licence statement on the article's last page:
© 2020 by the authors. Licensee MDPI, Basel, Switzerland. This article is an open access article distributed under the terms and conditions of the Creative Commons Attribution (CC BY) license (http://creativecommons.org/licenses/by/4.0/).
Attribution:
Squareness values (LaserTRACER calibration LTc1, read from Fig. 6; X–Y ballbar value from Table 8): M. Holub, R. Jankovych, J. Vetiska, J. Sramek, P. Blecha, J. Smolik, P. Heinrich, “Experimental Study of the Volumetric Error Effect on the Resulting Working Accuracy—Roundness”, Applied Sciences 10(18), 6233 (2020), https://doi.org/10.3390/app10186233. © 2020 by the authors, licensee MDPI, Basel, Switzerland. Licensed CC BY 4.0 (https://creativecommons.org/licenses/by/4.0/), provided as-is without warranties (CC BY 4.0 Section 5). Changes: three values read from a bar chart and rounded to 0.0001°; no figure reproduced.
Background. Renishaw white paper TE336, Ballbar testing in tandem with circle, diamond, square
machining tests, p. 9 (search terms: Renishaw TE336, or the title): ISO 10791-7's squareness
tolerance for the 320 mm test piece, 0.020 mm, as 62.5 µrad. Background only; nothing on this page is
judged against it.
The pictures and the charts. The pictures are HiNC captures, and the charts are drawn from HiNC's per-step results and cut meshes. Everything is simulated: nothing was cut, and none of the data set authors' machining results is used. From the paper, only three angles and one ballbar value are used. Neither the data set's authors nor the paper's endorse this case or HiNC.
See Also
- RPTU Benchmark Parts 4–10 — how part 8's project was built and accepted
- Building Virtual Machine Tools: Error terms — what a mark changes, the Enable Error Terms switch, and work offsets on a machine with error terms
- Kinematic Topology: Error-Term Branches — the nominal chain the controller solves, and which errors it can see
- Machining Issues Outside the Model: Machine Geometric Error — the machine errors the model leaves out, and the roundness Holub et al. measured before and after compensation
- Geometry Validation — the geometry difference, its detection radius and its colour scale
- Program Zero Alignment — P0, and typing in a measured work offset
- Showcase — the other cases, and how a case page reads